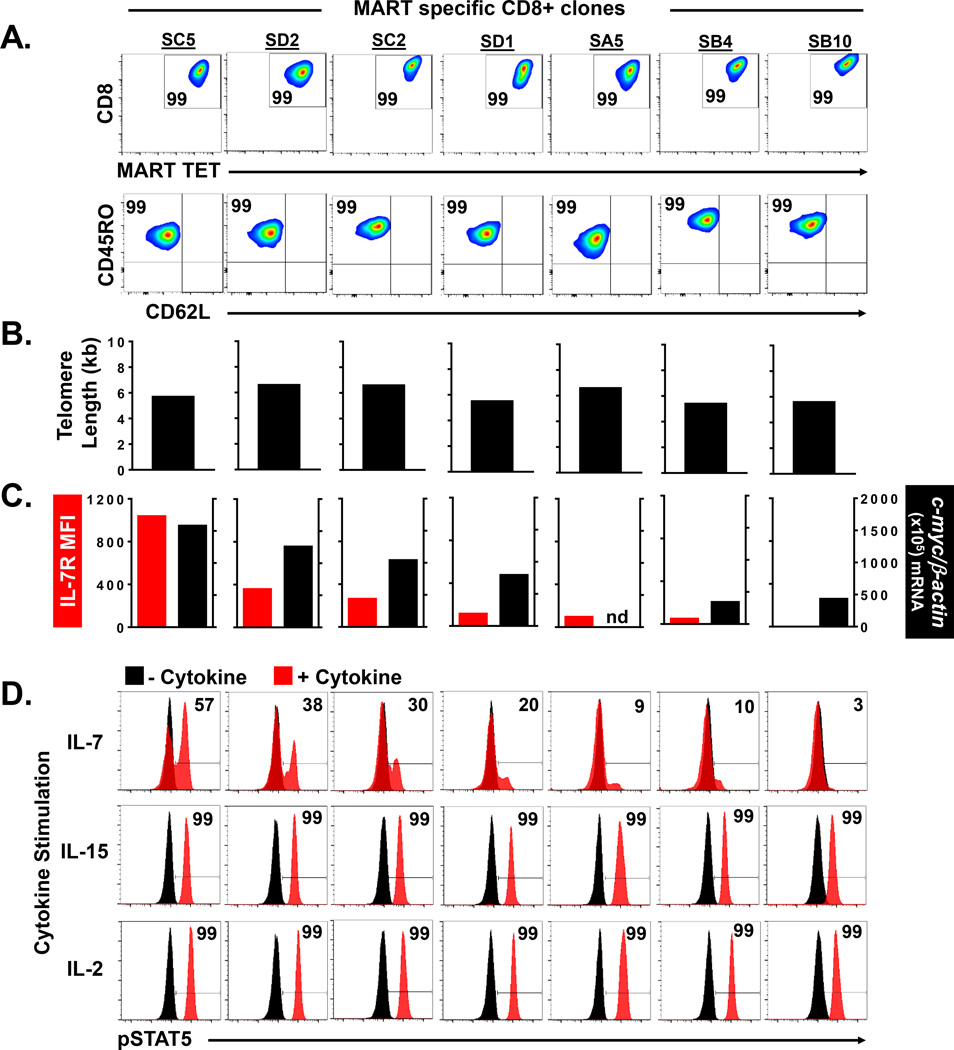
Figure 4. Prospective characterization of effector CD8+ T cell clones based upon by IL-7R and c-myc expression.
(A) Phenotype of individual MART specific CD8+ T effector clones (n=7) isolated by limiting dilution from the peripheral blood of a metastatic melanoma patient. Numbers in FACS plot represent % CD8+Tetramer+ cells (upper panel) and % CD45RO+CD62L− cells (lower panel) compared to isotype. (B) Telomere length of isolated effector clones. (C) Cell surface IL-7R expression (MFI) and c-myc mRNA (per 105 b-actin copies) expression in isolated effector clones. (D) Cytokine induced pSTAT5 expression (% of cells) in isolated CD8+ effector clones (n=7). Numbers in histograms represent % of cells induced to express pSTAT5 by respective cytokine compared to no cytokine baseline.

