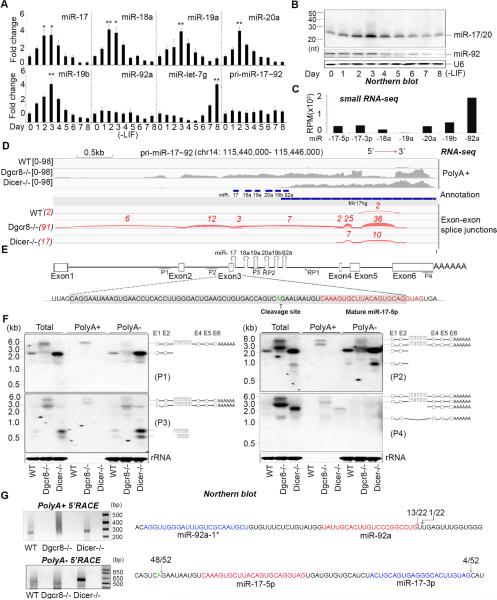
Figure 1. Posttranscriptional regulation of miR-17~92.
(A) q.RT-PCR analysis of miRNA and pri-miRNA expression in mouse ESCs over a differentiation time course. Data normalized to snoR142 (for miRNAs) and ACTIN (for pri-miRNA) and represented as mean +/− SEM. *p < 0.05, **p < 0.01, Student's t test. (B) Northern blot analysis of the RNAs from (A) using probes to detect the indicated miRNAs. U6 was used as control. (C) Relative read number of small RNA sequences mapping to the indicated miRNAs in ESCs. RPM: reads per million. (D) Mapping of RNA-seq cDNA sequence to the mouse miR-17~92 locus. cDNAs were prepared and sequenced from wt, Dgcr8−/−, and Dicer−/− ESCs. Exon-exon boundaries and read numbers from sequencing data are shown (Red). Tophat (http://ccb.jhu.edu/software/tophat/index.shtml) was used for the analysis (E) Schematic representation of the mouse miR-17~92 locus. P1, P2, P3, and P4 indicate the probes used for Northern blots in (F). RP1, and RP2, indicate the position of the primers used for the 5’ RACE experiments presented in (G). Sequence of exon 3 (shaded gray) includes the position of the cleavage site identified by 5’ RACE (green font) and the miR-17-5p sequence (red font). (F) Northern blots performed on indicated RNAs. Probes are indicated (left) and the schematic (right) represents an interpretation of the Northern blot data (G) 5’ RACE data from Dicer−/− ESCs using the indicated primers. Ethidium bromide stained agarose gel analysis of RACE products (left) and summary of RACE sequencing data (right). The numbers indicate the proportion of all sequences that map to a particular nucleotide. Mature miRNA sequences are highlighted in red and miR-17-3p and miR-92a-1* highlighted in blue.

