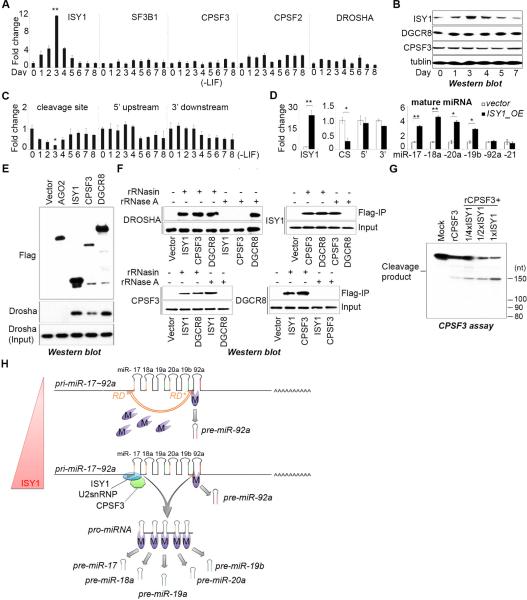
Figure 7. Pro-miRNA biogenesis controls miR-17~92 expression in embryonic stem cells.
(A) q.RT-PCR analysis of the indicated mRNA over a differentiation time course. Data are normalized to ACTIN and represented as mean +/− SEM. **p < 0.01, Student's t test. (B) Western blot analysis. (C) q.RT-PCR analysis of the relative expression of regions of the endogenous pri-miR-17~92 during ESC differentiation. Primers amplifying a region spanning the cleavage site (CS), a region in the 5’ upstream sequence (5’), and a region in the 3’ downstream sequence (3’) of pri-miR-17~92 were used. Data are normalized to ACTIN and represented as mean +/− SEM. *p < 0.05, Student's t test. (D) q.RT-PCR analysis of ectopic ISY1 expression, endogenous pri-miR-17~92 expression using the primers as in (C) and the endogenous miRNAs indicated. Data are normalized to sno142 (for miRNAs) and ACTIN (for pri-miRNA) and represented as mean +/− SEM. *p < 0.05, **p < 0.01, Student's t test. (E, F) Co-immunoprecipitation (co-IP) assays performed by using the indicated Flag-tagged cDNAs, performing Flag-affinity purifications, and analyzing the affinity eluate Western blot using indicated antibodies. Where indicated lysates and IPs were treated with RNase A. (G) CPSF cleavage assays with His-CPSF3 and Flag-ISY1 complex purified from HEK293 cells. (H) Model for the posttranscriptional control of miR-17~92 biogenesis.

