
Fig. 4.
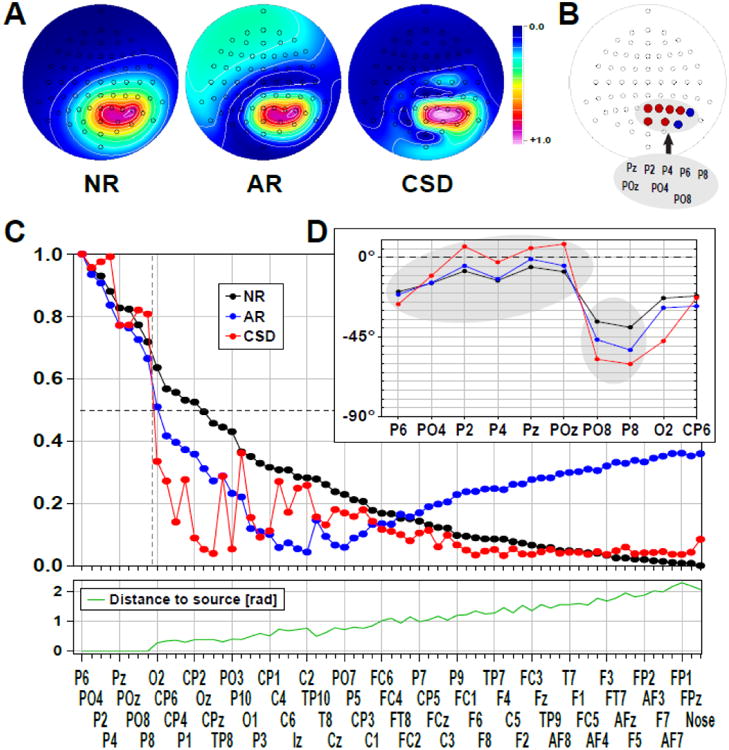
Model 2. Peak amplitude spectrum (FFT amplitude at 10 Hz) for NR and AR EEG and CSD (m = 4) derived from two contiguous regions composed of 90 degree phase-shifted, shallow radial sinusoidal dipoles. A. Although all amplitude topographies show a distributed maximum within the (combined) active regions, the border for the CSD topography is considerably sharper. The AR has an intermediate falloff, but misallocates activity to distant inactive sites (i.e., left anterior). Each data set is individually scaled to 1. B. Schematic to indicate locations of active regions. Region 1 (red dots) contains shallow radial cosine dipoles at six posterior sites (Pz, POz, P2, P4, PO4, P6). Region 2 (blue dots) is immediately adjacent to region 1, and contains shallow radial sine dipoles (P8, PO8). C. Amplitude at each electrode shown A, sorted by NR amplitude. The dashed vertical line at the left separates active from inactive (volume conducted) electrodes, the dashed horizontal line marks half the maximum amplitude. Again, CSD amplitude shows the sharpest falloff between active and inactive sites. D. Peak phase at active (shaded) and adjacent sites, sorted as in Fig. 4B. The maximum phase difference between Region 1 and Region 2 exceeds 65E for CSD. NR shows the smallest phase difference between regions, with the AR intermediate between them.