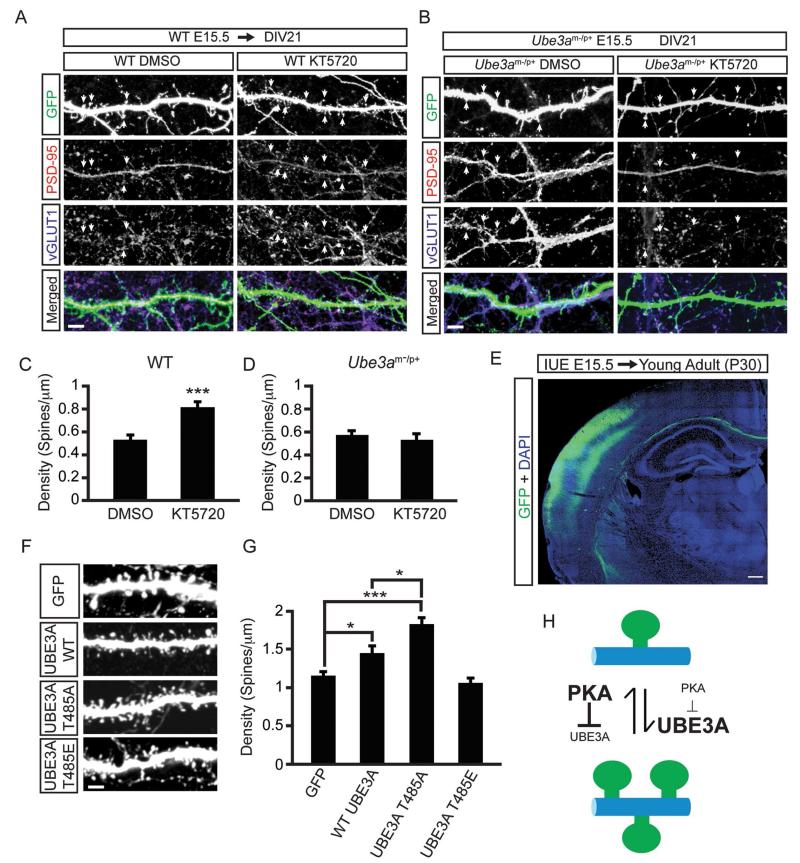
Figure 7. UBE3A T485A phospho-mutant abnormally increases dendritic spine formation in vivo.
(A) Confocal projections showing synapse formation in WT neurons treated with vehicle (DMSO; left panels) or 1 μM KT5720 (right panels) for 48 h (DIV 19-21), scale bar, 4 μm.
(B) Confocal projections showing synapse formation in Ube3am−/p+ treated with vehicle (DMSO; left panels) or 1 μM KT5720 (right panels) for 48 h (DIV 19-21), scale bar, 4 μm. GFP is shown in green, PSD-95 immunofluorescence in red, and vGLUT1 immunofluorescence in blue.
(C and D) Quantification showing increased spine densities with KT5720 treatment in WT neurons (C) but not in Ube3am−/p+ neurons (D). Values are shown as the mean spine densities ± standard error. n=25-30 neurons/condition; ***p<0.0005.
(E) Low magnification confocal image showing transfected neurons (green) in the cortex of young adult (P30) animals after in utero electroporation (IUE) at E15.5. Nuclear stain DAPI (blue). Scale bar, 200 μm.
(F and G) Representative images of dendrites showing spine densities in neurons expressing the indicated constructs, and quantification (G); scale bar, 2 μm. Values are shown as mean spine densities ± standard error. n=20-25 neurons/condition, *p<0.05, ***p<0.0005.
(H) Model of PKA and UBE3A signaling in spine growth. Text size is proportional to enzyme activity level.

