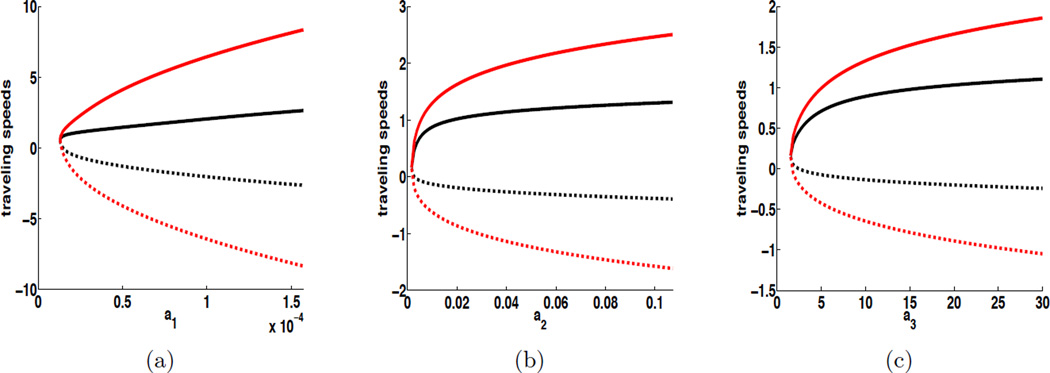
Figure 3.
Influence of D2 and D4 on cholera traveling wave speeds when υ = 1, which is illustrated by plotting cholera traveling wave speeds as a function of ai (i = 1, 2, 3). The base values of a1, a2 and a3 are a1 = 1.57 × 10⁻⁵ (day−1), a2 = 0.011 (person−1·day−1), and a3 = 10 (cells · ml−1·day−1). For each plot, the upper solid curve refers to the progressive velocity c+ and the lower dashed curve refers to the regressive velocity c−. The curves in black (resp. red) show the critical cholera spreading speeds when D2 = D4 = 1 (resp. D2 = D4 = 10).

