Fig. 1.
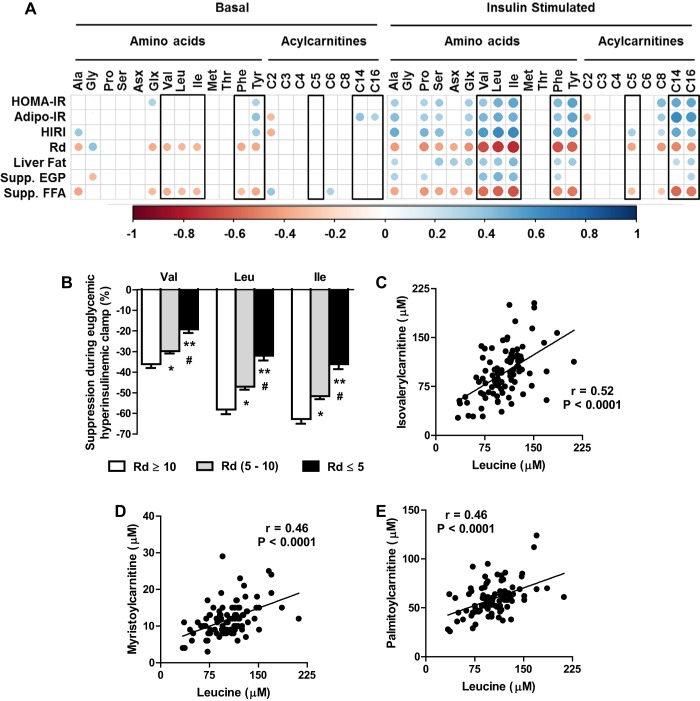
Targeted metabolomics coupled to hyperinsulinemic euglycemic clamps in human subjects. A: correlation between indices of insulin sensitivity and metabolites profiled after an overnight fast (basal) and during insulin stimulation (euglycemic hyperinsulinemic clamp). Only correlations that are significant at P < 0.05 are represented with circles in the matrix. Areas and the color intensity of the circles in the correlation plot indicate the absolute value of the corresponding correlation coefficients. B: impaired suppression of BCAA during insulin stimulation in human subjects with increasing severity of muscle insulin resistance [glucose disposal (Rd)]. C–E: relationships between leucine (C), isovalerylcarnitine myristoylcarnitine (D), and palmitoylcarnitine (E) during euglycemic hyperinsulinemic clamp. Values in the bar graph are represented as means ± SE. *P < 0.05 between “Rd ≥ 10” and “Rd (5–10)”; **P < 0.05 between Rd ≥ 10 and “Rd ≤ 5”; #P < 0.05 between Rd (5–10) and Rd ≤ 5. Ala, Alanine; Gly, Glycine; Pro, Proline; Ser, Serine; Asx, aspartate/asparagine; Glx, glutamate/glutamine; Val, valine; Leu, leucine; Ile, isoleucine; Met, methionine; Thr, threonine; Phe, phenylalanine; Tyr, tyrosine; C2, acetylcarnitine; C3, propionylcarnitine; C4, butyrylcarnitine; C5, isovalerylcarnitine; C6, hexanoylcarnitine; C8, octanoylcarnitine; C14, myristoylcarnitine; C16, palmitoylcarnitine.

