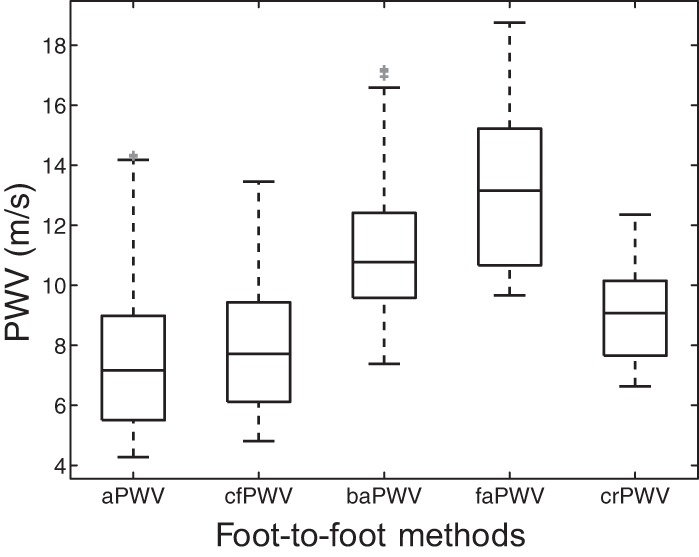
Fig. 3.

Distribution of central and peripheral foot-to-foot PWV of our virtual database. Each box indicates the 25th percentile, median, and 75th percentile; whiskers extend to minimum and maximum data points. Outliers are plotted individually in grey.
