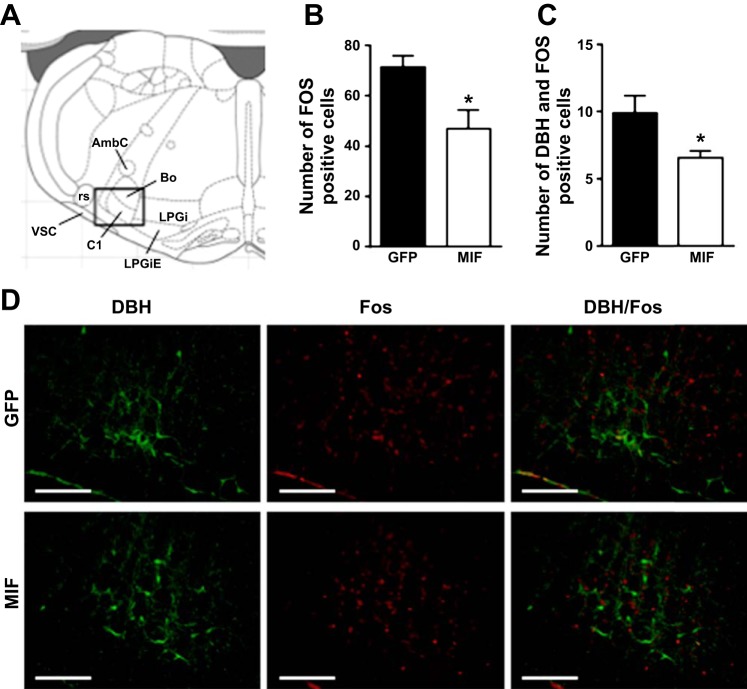
Fig. 5.
A: diagram of a coronal section of the brainstem 12.24 mm posterior from bregma taken from Paxinos and Watson (48). Rectangle indicates the location of images taken to analyze c-Fos expression. Numbers of c-Fos-positive (B) and DβH/c-Fos double labeled (C) cells in the RVLM of GFP (n = 9)- and MIF-treated (n = 9) SHRs. Rats were euthanized and the tissue collected 120 min after the onset of the 60-min restraint stress. Representative fluorescence photomicrographs (D) showing c-Fos (red) and dopamine-β-hydroxylase (DβH; green) expression in the RVLM of GFP- and MIF-treated SHRs in coronal brain sections at 12.2–12.4 mm posterior from bregma. Scale bars = 200 μm. AmbC, ambiguous nucleus, compact part; Bo, Botzinger complex; C1, C1 adrenalin cells; LPGi, lateral paragigantocellular nucleus; LPGiE, lateral paragigantocellular nucleus, external part; rs, rubrospinal tract; vsc, ventral spinocerebellar tract. Results are represented as means ± SE; *P < 0.05 MIF vs. GFP.

