
Figure 6.
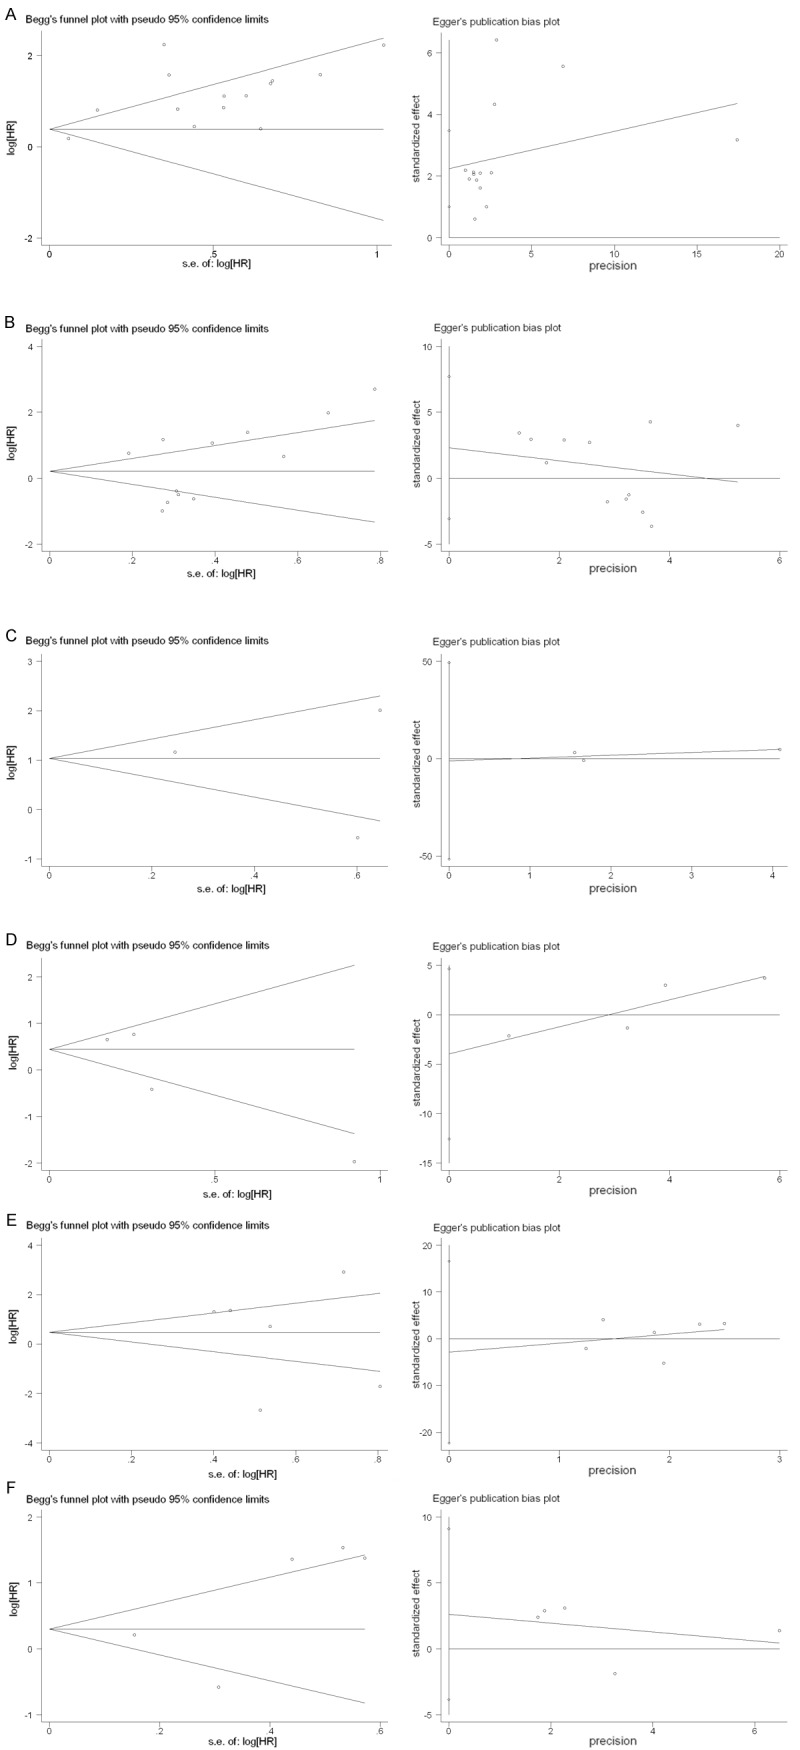
Begg’s funnel graph and Egger’s test for assessment of potential publication bias in studies of STAT3/p-STAT3 in patients with tumors. A. OS for STAT3. B. OS for p-STAT3. C. DFS for STAT3. D. DFS for p-STAT3. E. Stage for STAT3. F. Stage for p-STAT3. The funnel graph plots log HR against the standard error of the log HR.