
Figure 1.
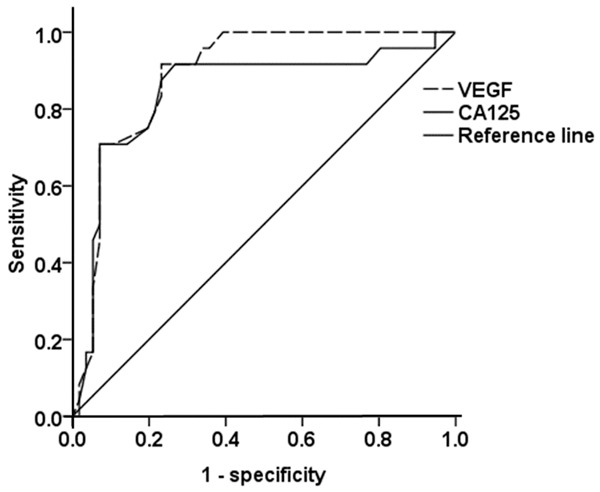
ROC analysis for analyzing the treatment effect on adenomyosis. ROC analysis was analysis the treatment effect of interventional therapy on adenomyosis according to the levels of VEGF and CA125 in serum. The area under ROC curve was 88.8% and 84.6% for the serum levels of VEGF and CA125, respectively. The optimal cut-off value of the serum levels of VEGF and CA125 was 160.8 pg/ml and 100.4 ku/l.