
Figure 2.
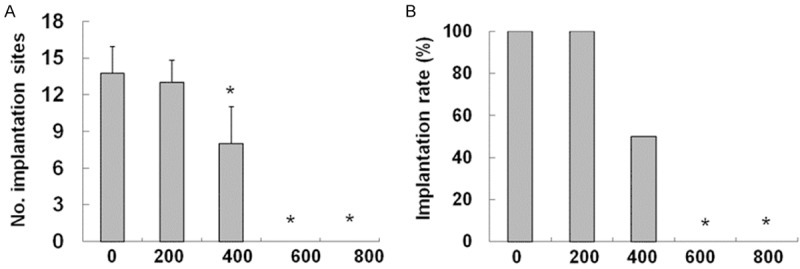
Effects of BPA on the implantation site numbers and implantation rates. A. Effect of BPA on the amount of implantation sites of mice on Day 4.5 of pregnancy. The number of blue belts on the uteri of mice in the control group and treatment groups was counted as the number of implantation sites. N = 10 to 14. The number of implantation sites at each dose was averaged. Error bars: standard deviation. *P < 0.05, compared with the control group. B. Effect of BPA on the implantation rate of mice on Day 4.5 of pregnancy. Implantation rate = total number of mice with implantation sites/total number of mice with fertilized embryos in the genital tract × 100, N = 10 to 15. *P < 0.05, compared with the control group.