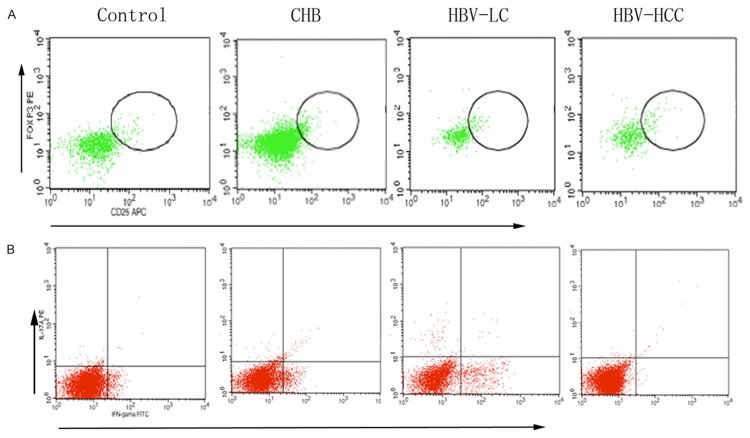
Figure 1.
Representative dot plots of FoxP3 and IL-17A. A. Representative dot plots of FoxP3 expression in peripheral CD4+T cells of Controls, CHB, HBV-LV, HBV-HCC. B. Representative dot plots of IL-17A a expression in peripheral CD4+T cells of Controls, CHB, HBV-LV, HBV-HCC. Chronic hepatitis B virus infection (HBV), chronic hepatitis B (CHB), hepatitis B-associated liver cirrhosis (HBV-LC), hepatitis B-associated hepatocellular carcinoma (HBV-HCC), regulatory T cells (Treg), IL-17+ T helper cells (Th17).

