
Figure 6.
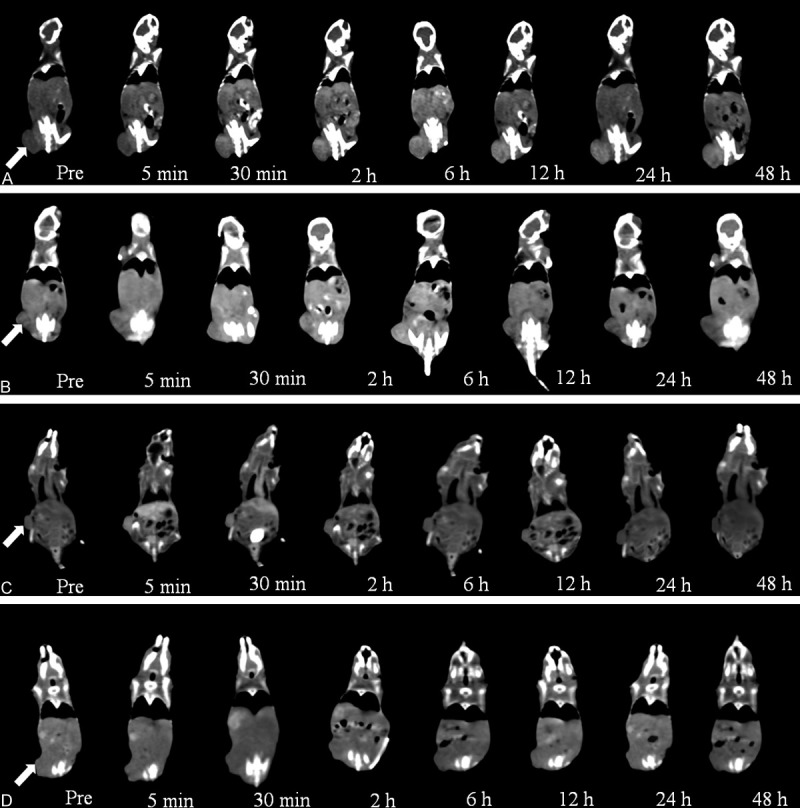
In vivo CT images of ovarian cancer xenografts at various times. A. Targeted group; B. Non-targeted group; C. Iohexol group; D. Control group. The arrows indicate the tumors.
Official websites use .gov
A
.gov website belongs to an official
government organization in the United States.
Secure .gov websites use HTTPS
A lock (
) or https:// means you've safely
connected to the .gov website. Share sensitive
information only on official, secure websites.
In vivo CT images of ovarian cancer xenografts at various times. A. Targeted group; B. Non-targeted group; C. Iohexol group; D. Control group. The arrows indicate the tumors.