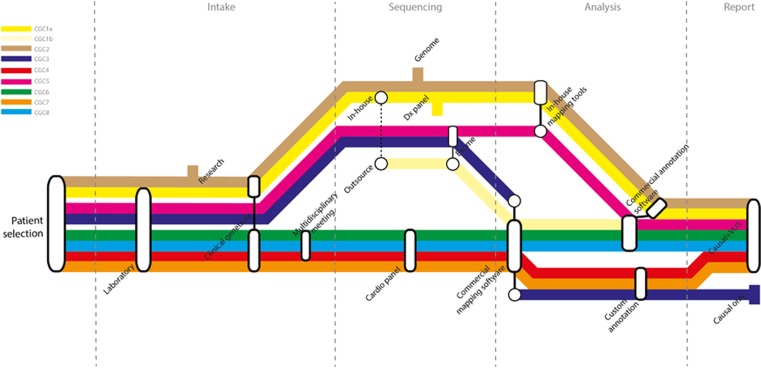
Figure 1.
Overview of the diagnostic process. The diagnostic process of nine samples with cardiomyopathies varied substantially among CGCs. Each colored line represents the process the nine patients went through in a particular CGC. The ‘metro stops' represent choices that the various CGCs made in the intake, sequencing, analysis and reporting phase.

