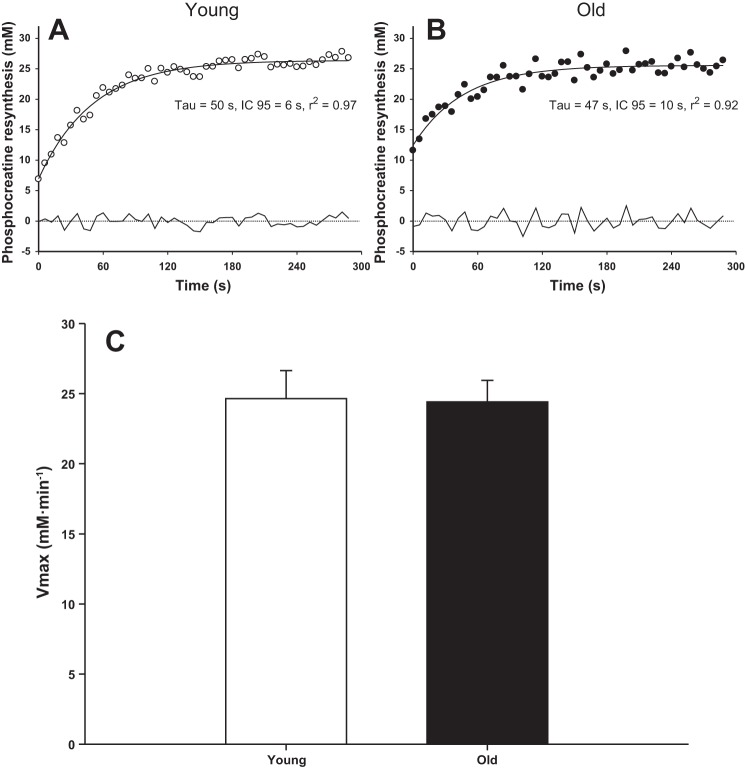
Fig. 5.
Phosphocreatine dynamics fitted according to a monoexponential function during the recovery period in a representative young (○, A) and old (●, B) subject and the mean peak rate of mitochondrial ATP synthesis (Vmax, C). The residuals to the fitted responses are documented below the curves. Vmax was not significantly different between the young and old (P > 0.05).

