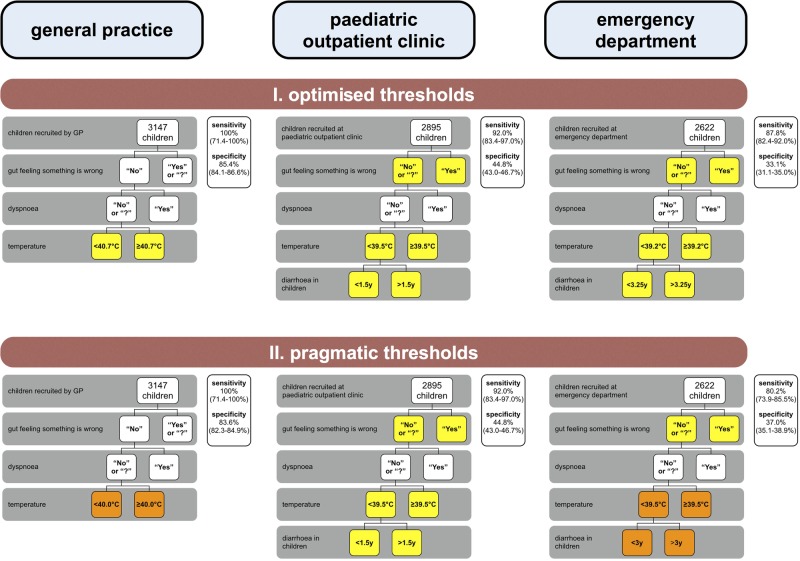
Figure 4.
Validation results after applying optimised and pragmatic thresholds to the four-step decision tree. Yellow boxes, threshold changes after applying the optimisation using classification and regression tree analysis (CART); orange boxes, additional threshold changes after applying the pragmatic approach; sensitivity and specificity are given for every tree with their respective 95% CIs in brackets; y, years.

