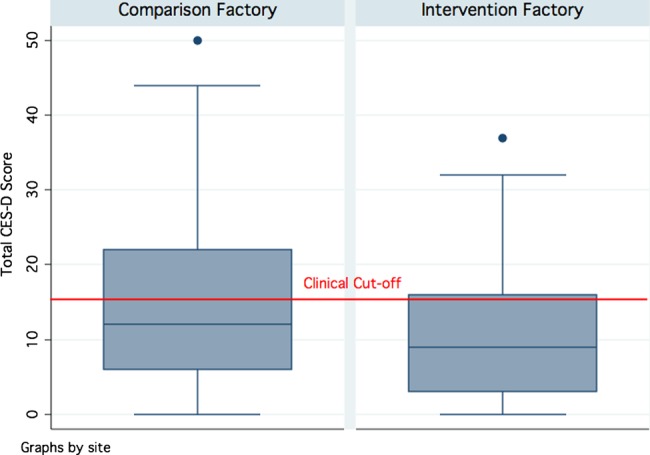
Figure 1.

Distribution of total CES-D scores for comparison and intervention factory workers. Boxes denote the IQR between the first and third quartiles (25th and 75th centiles, respectively) and the blue line inside denotes the median. Whiskers denote the lowest and highest values within 1.5 times IQR from the first and third quartiles, respectively. Circles denote outliers beyond the whiskers. The red line denotes the total CES-D score of 16 that has frequently been used as the cut-off indicating clinical levels of distress. CES-D, Center for Epidemiologic Studies-Depression Scale.
