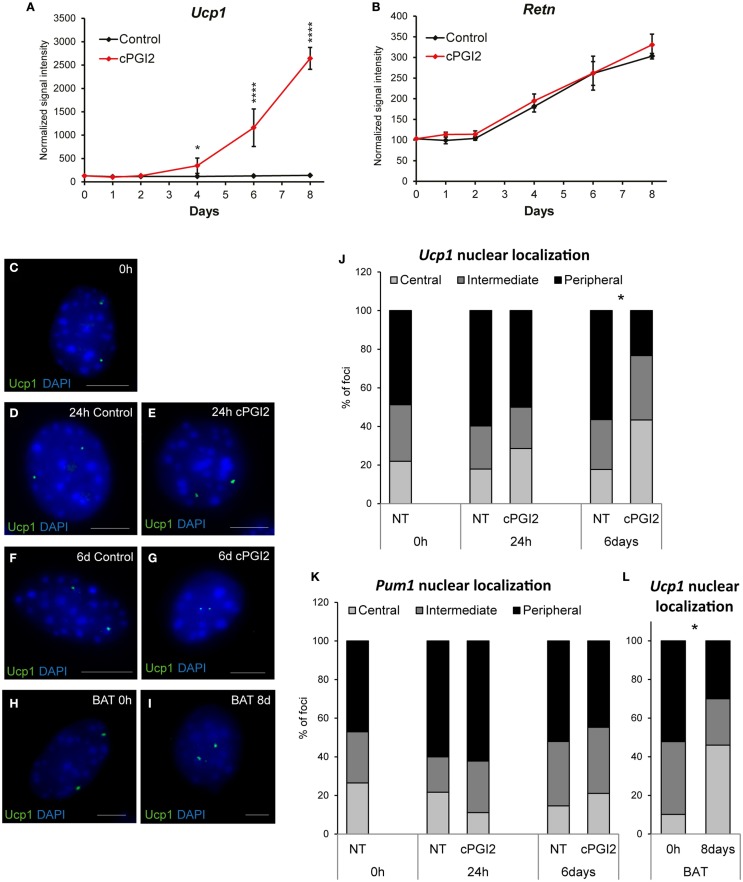
Figure 2.
Late non-linear upregulation of Ucp1 expression by cPGI2 and associated late nuclear relocalization of the Ucp1 gene locus. Lin−CD29+CD34+Sca-1+ cells were cultured in adipogenic media ± cPGI2. (A,B) RNA was obtained at the indicated time points for expression profiling with Illumina beadchip arrays (n = 3). Normalized signal intensities for the indicated genes/probes are shown (asterisks indicate Bonferroni cPGI2 vs. Control *p < 0.05, ****p < 0.0001). (C–L) Cells were fixed for 3D nuclear architecture-preserving DNA–FISH analysis in the undifferentiated state (0 h) (C) and at 24 h (D,E) or 6 days (F,G) of differentiation with (E,G) or without (D,F) cPGI2. Cells from interscapular BAT (without cPGI2) were analyzed at 0 h or 8 days (H,I). The Ucp1 gene locus (C–I) was detected using an AlexaFluor® 488-5-dUTP-labeled probe (green) and the cells were stained with DAPI (blue). Representative images of progenitor and adipocyte nuclei are shown (scale bar 10 μm). (J) For quantitative analysis of Ucp1 localization, the nuclei were segmented into three shells (Central/Intermediate/Peripheral). The distribution of Ucp1 loci under the indicated conditions is shown (* indicates χ2 test cPGI2 vs. Control p = 2.4 × 10⁻⁸, n = 30–50). (K) Distribution of the Pum1 locus as detected in Figures S4B,C in Supplementary Material. (L) Distribution of the Ucp1 locus in cells from interscapular BAT (* indicates χ2 test 8 days vs. 0 h p = 4.8 × 10⁻¹⁶, n = 30–50).

