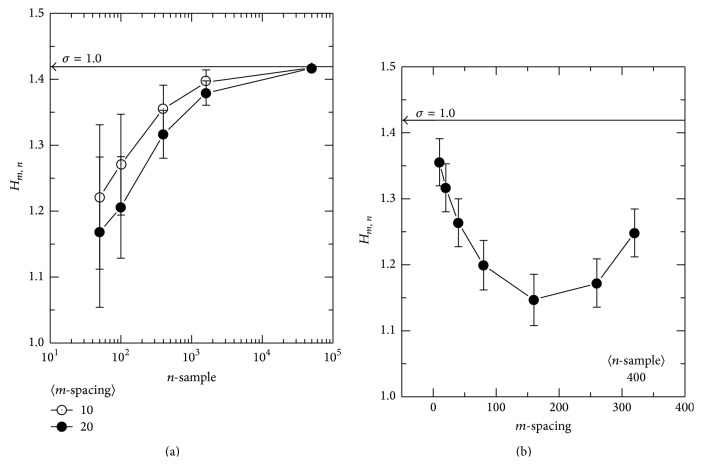
Figure 1.
The n-dependence (a) and m-dependence (b) of the entropy estimator H m,n. An ensemble of 3,000 sets of random sampling from N(0, 12) was constructed and used for each point in the plot. The sample-spacing, m, was fixed while varying the number of samples, n, (a) to evaluate the n-dependence of the entropy estimator. In (b), n was fixed and m was varied to show the m-dependence. Analytically obtained true values are represented by the arrowed horizontal lines.

