. 2015 Jul 30;4:e07389. doi: 10.7554/eLife.07389

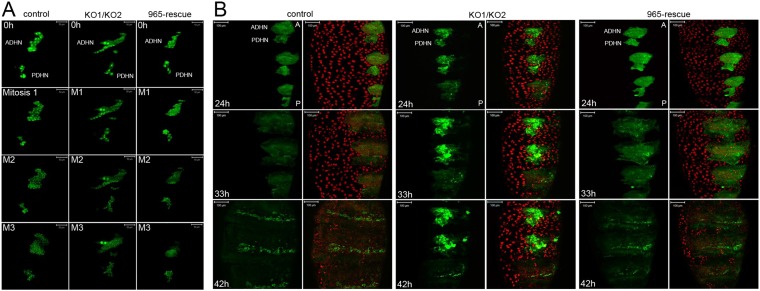
Figure 3. Abnormal histoblast proliferation and migration in the miR-965 mutant.

(A) Still images taken from time-lapse videos of control, miR-965 mutant (KO1/KO2) and rescued mutant showing the reduction divisions of the early histoblast proliferation phase. M1, M2 and M3 indicate images taken after mitosis 1, 2 or 3. Imaging was started 0–1 hr APF. Histoblasts were labeled by esg-Gal4 directed expression of UAS-nuclear GFP. ADHN and PDHN represent anterior dorsal histoblast nests and posterior dorsal histoblast nests. Scale bars: 50 µm. Note the different cell sizes in the miR-965 mutant histoblast nests. (B) Still images taken from time-lapse videos at 24, 33 and 42 hr APF from control, miR-965 mutant and rescued mutant to illustrate expansion of the histoblast nests to replace LECs. Histoblasts were labeled by esg-Gal4 directed expression of cytoplasmic GFP. esg-GAL4 and UAS-GFP were recombined onto the miR-965 mutant and onto the miR-965 Rescue chromosome. Nuclei were labeled red with H2-RFP A and P indicate anterior and posterior orientation. Scale bars: 100 µm.

DOI: http://dx.doi.org/10.7554/eLife.07389.008

Figure 3.

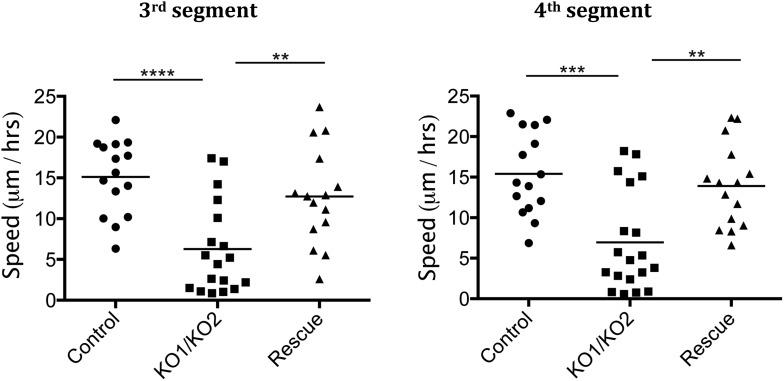
Figure 3—figure supplement 1. Rate of histoblast nest expansion measured from time-lapse videos.

Figure 3—figure supplement 1.

Each data point corresponds to one histoblast nest. The leading edge of each histoblast nest was tracked using imageJ. Speed was calculated measuring total distance covered (micrometer/hour). Genotypes: Control was esg-GAL4, UAS-GFP. esg-GAL4 and UAS-GFP were recombined onto the KO1 and KO2 chromosomes and onto the miR-965-Rescue chromosome. Data include examples with both recombinant mutant chromosomes. No difference between these two recombinants was apparent. n = 18 for the miR-965 (KO1/KO2) mutant combination. n = 15 for control and rescue. Left panel: p < 0.0001 comparing KO1/KO2 with control, p < 0.01 comparing KO1/KO2 with rescue using one-way ANOVA. Right panel: p < 0.001 comparing KO1/KO2 with control, p < 0.01 comparing KO1/KO2 with rescue using one-way ANOVA. Refers to Figure 3B and Videos 5–7.
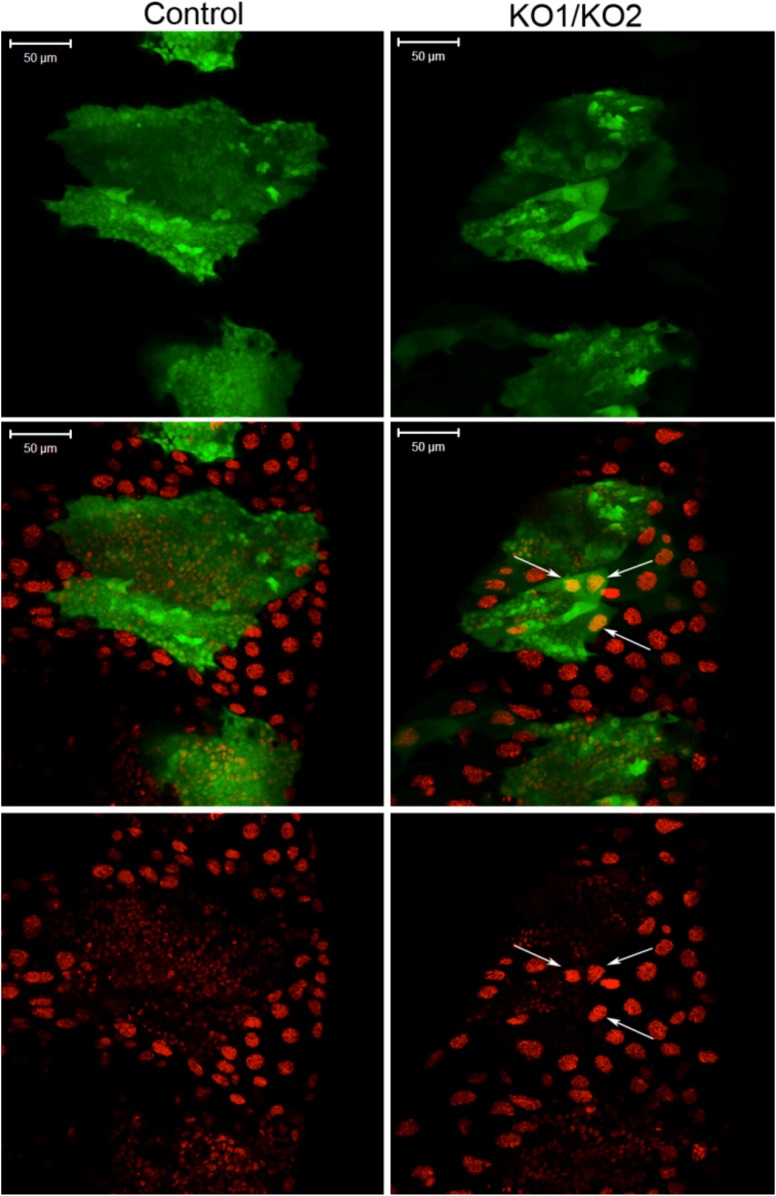
Figure 3—figure supplement 2. Large polyploid cells in miR-965 mutant histoblast nests.

Figure 3—figure supplement 2.

Histoblast nests were labeled with esg-Gal4-directed expression of UAS-GFP at 24 hr APF. Note the presence of large polyploid cells in the histoblast nest in the miR-965 mutant (arrows). At the start of the imaging period, the large polyploid cells marked by the arrows did not express GFP, but began to express GFP after making contact with the expanding histoblast nests. Possible explanations for the appearance of GFP in large polyploidy cells include (1) induction of esg-Gal4 activity in the larval cells that cannot be eliminated by the expanding histoblast nests, perhaps by signals from the histoblasts; (2) fusion of polyploidy LEC with esg-Gal4-expressing histoblasts. Scale bar: 50 µm. Refers to Figure 3B.
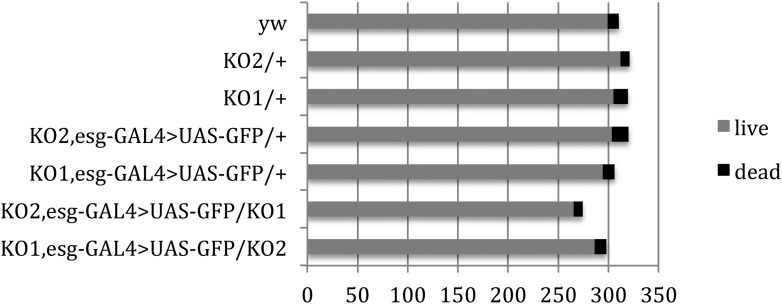
Figure 3—figure supplement 3. Pupal survival assays.

Figure 3—figure supplement 3.

Pupal survival was assayed for flies of the indicated genotypes. 6 batches of pupae were sampled/genotype. The data present the total number of surviving adults (live) and the total number of dead pupae (dead). There was no significant difference between the mutant and control genotypes used to make the videos: p = 0.67 comparing KO2 esgG4>GFP/+ vs KO2 esgG4>GFP/KO1 (Mann–Whitney test). p = 1 comparing KO1 esgG4>GFP/+ vs KO1 esgG4>GFP/KO2 (Mann–Whitney test). Refers to Figure 3B.