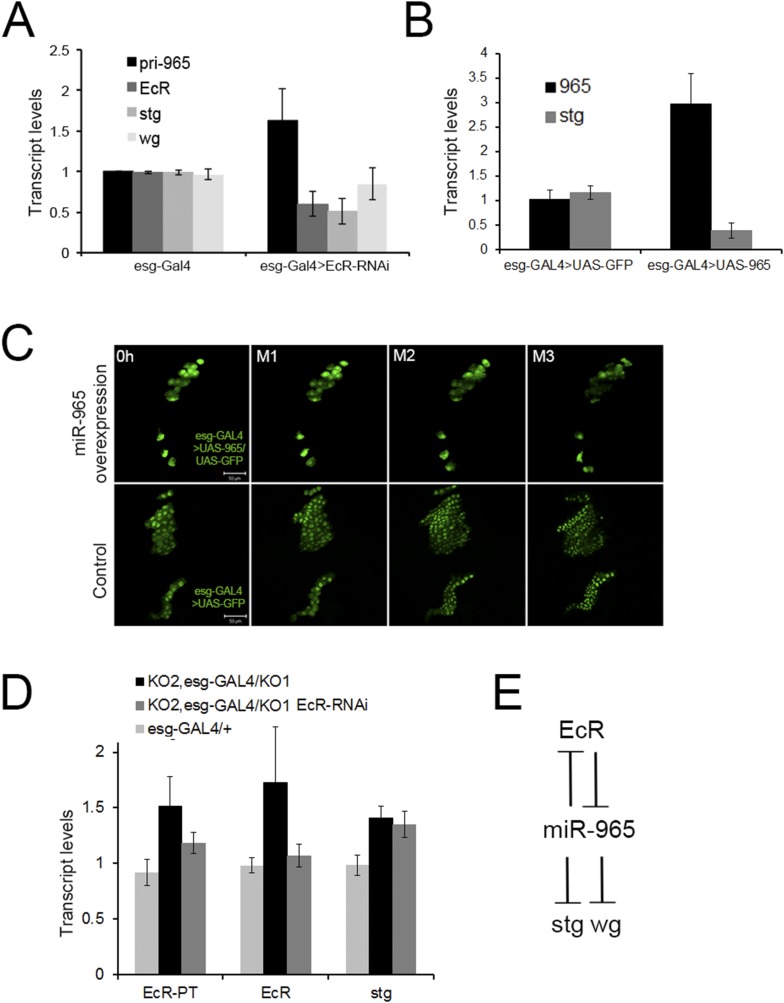
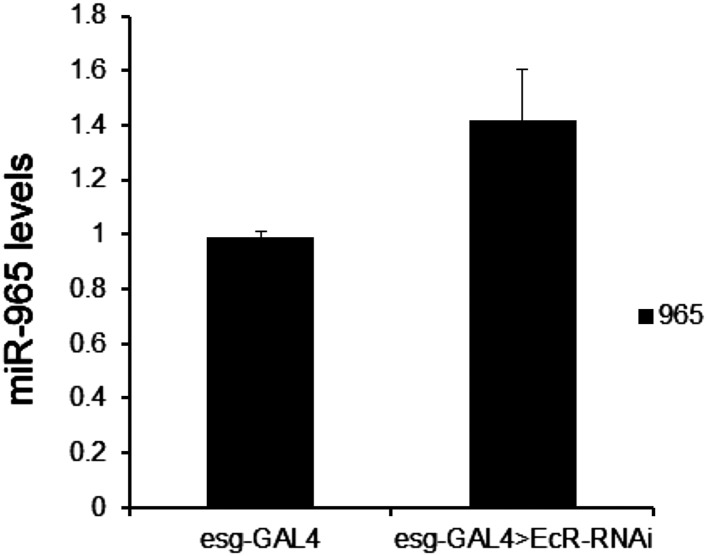
Figure 6. Regulation of miR-965 by ecdysone at the beginning of pupariation.
(A) Quantitative RT-PCR showing levels of miR-965 primary transcript, EcR, and string mRNAs in RNA isolated from pupae expressing esg-GAL4 (control) and esg-GAL4 driving UAS-EcR-RNAi to deplete EcR mRNA. Samples were collected at 0 hr APF. Data were normalized to rp49 and to the esg-GAL4 control. Data represents average of three independent samples ± SD. (B) Quantitative RT-PCR showing string mRNA in 0 hr pupae overexpressing miR-965 in histoblast cells. For quantitative microRNA PCR, data were normalized to U14, U27, SnoR422. Data were normalized to rp49 for string mRNA qPCR. Data represent the average of four independent samples ± SD. (C) Images from time-lapse videos showing the effects of miR-965 overexpression in histoblast cells during the synchronous division phase. M1, M2 and M3 indicate three consecutive mitotic divisions in dorsal histoblast nests. Scale bar: 50 µm. (D) Quantitative RT-PCR showing levels of string, EcR primary transcript (EcR-PT) and mature mRNA in RNA isolated from pupae expressing esg-GAL4 (control), esg-GAL4 in the miR-965 mutant with and without UAS-EcR-RNAi to deplete EcR mRNA. esg-GAL4 was recombined onto the KO2 mutant chromosome. Samples were collected at 0 hr APF. Data were normalized to rp49 and to the esg-GAL4 control. Data represents average of six independent samples ± SD. p = 0.37 for stg levels between KO2, esg-GAL4/KO1 and KO2, esg-GAL4/KO1>EcR-RNAi. p ≤ 0.01 comparing primary and mature EcR transcripts between esg-GAL4 control and KO2, esg-GAL4/KO1 mutant samples. (E) Diagram of the regulatory relationships between EcR, miR-965 and the miR-965 targets string and wg. The symbols represent repression of gene expression. miR-965 and EcR repress each other at the primary transcript level. The effect of miR-965 on EcR primary transcript is most likely indirect.


