Figure 2.

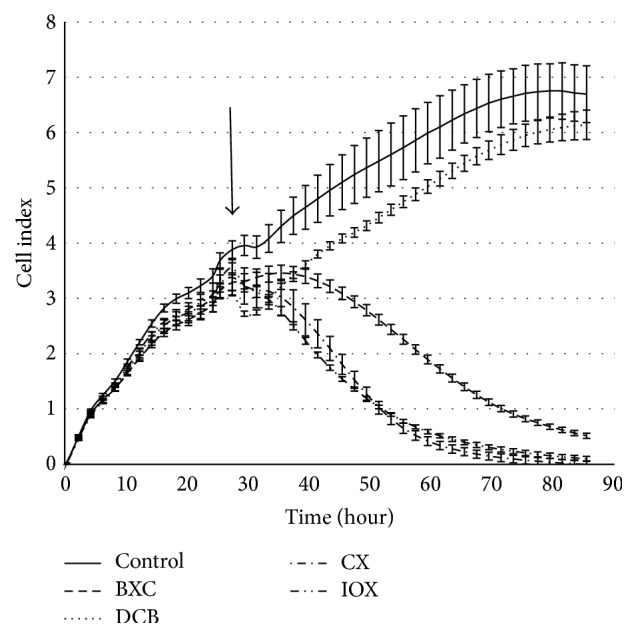
The growth curves of Hep G2 cells in the presence of benzonitrile herbicides (100 mg/L). The arrow indicates the time of the application of tested compounds. Error bars are standard deviation of 3 parallels.

The growth curves of Hep G2 cells in the presence of benzonitrile herbicides (100 mg/L). The arrow indicates the time of the application of tested compounds. Error bars are standard deviation of 3 parallels.