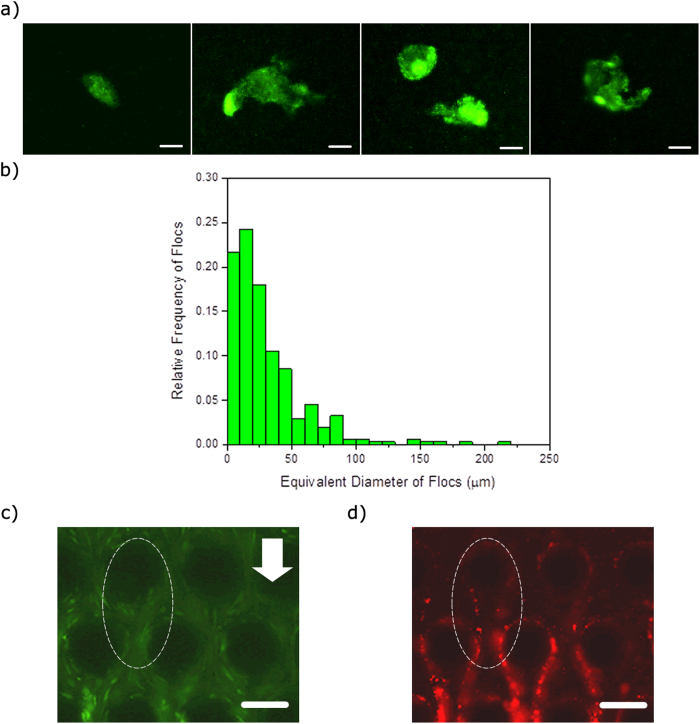
Figure 2.
(a) Flocs of P. fluorescens bacteria after incubation at 30 °C for 2 days. The scale bars are 25 μm. (b) Relative frequency histogram of the flocs. The x-axis is equivalent diameter of the flocs in the reservoir. The median and mode for this relative frequency histogram are 21.28 and 22.23 μm, respectively. (c,d) Green and red fluorescent images, respectively, of the microchannel after injecting the bacteria with 200 nm fluorescent red polystyrene beads particles into it. The images were taken at the same time and place that was approximately at the middle of the channel height (z = 25 μm). The red fluorescent particles clearly seed and enable visualization of the streamer. Note the regions demarcated by dashed ellipses where bacteria (green) are not significant, but the streamer itself is easy visualized due to red particles seeding the EPS network. The scale bars are 50 μm.

