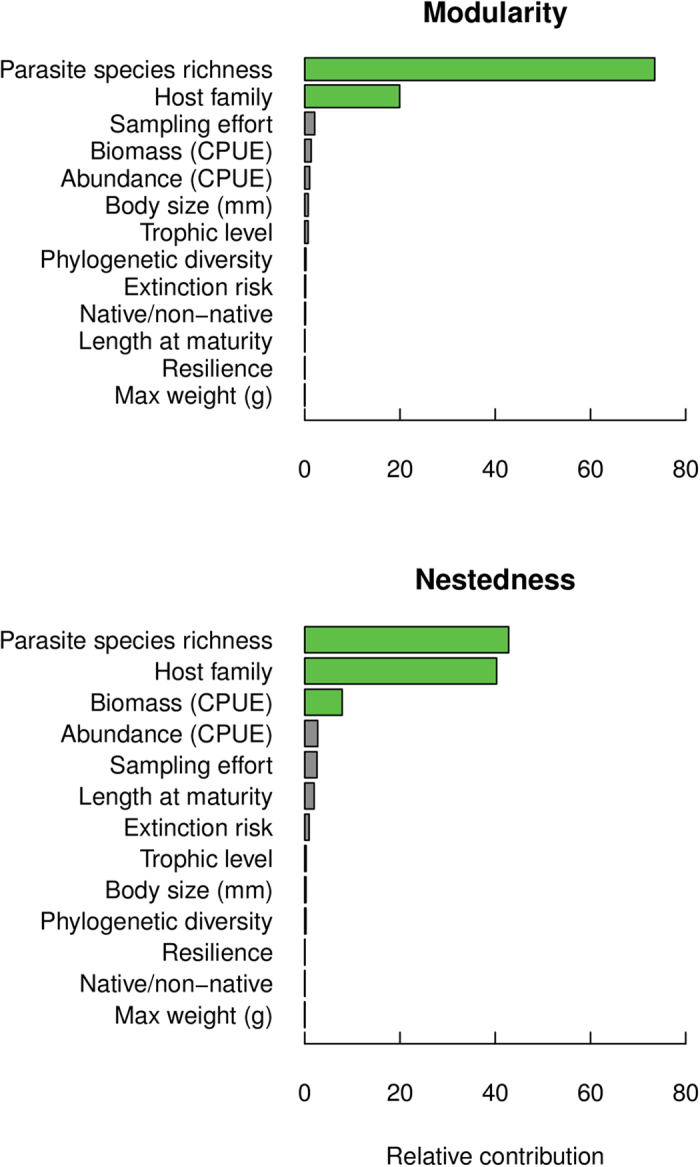
Figure 1. Species contributions to nestednesss and modularity as functions of life history traits.

Boosted regression models for modularity (top) and nestedness (bottom) contributions of host species, with green bars indicating fish species traits associated with their contribution to either measure of network structure (relative contribution values greater than 5%).
