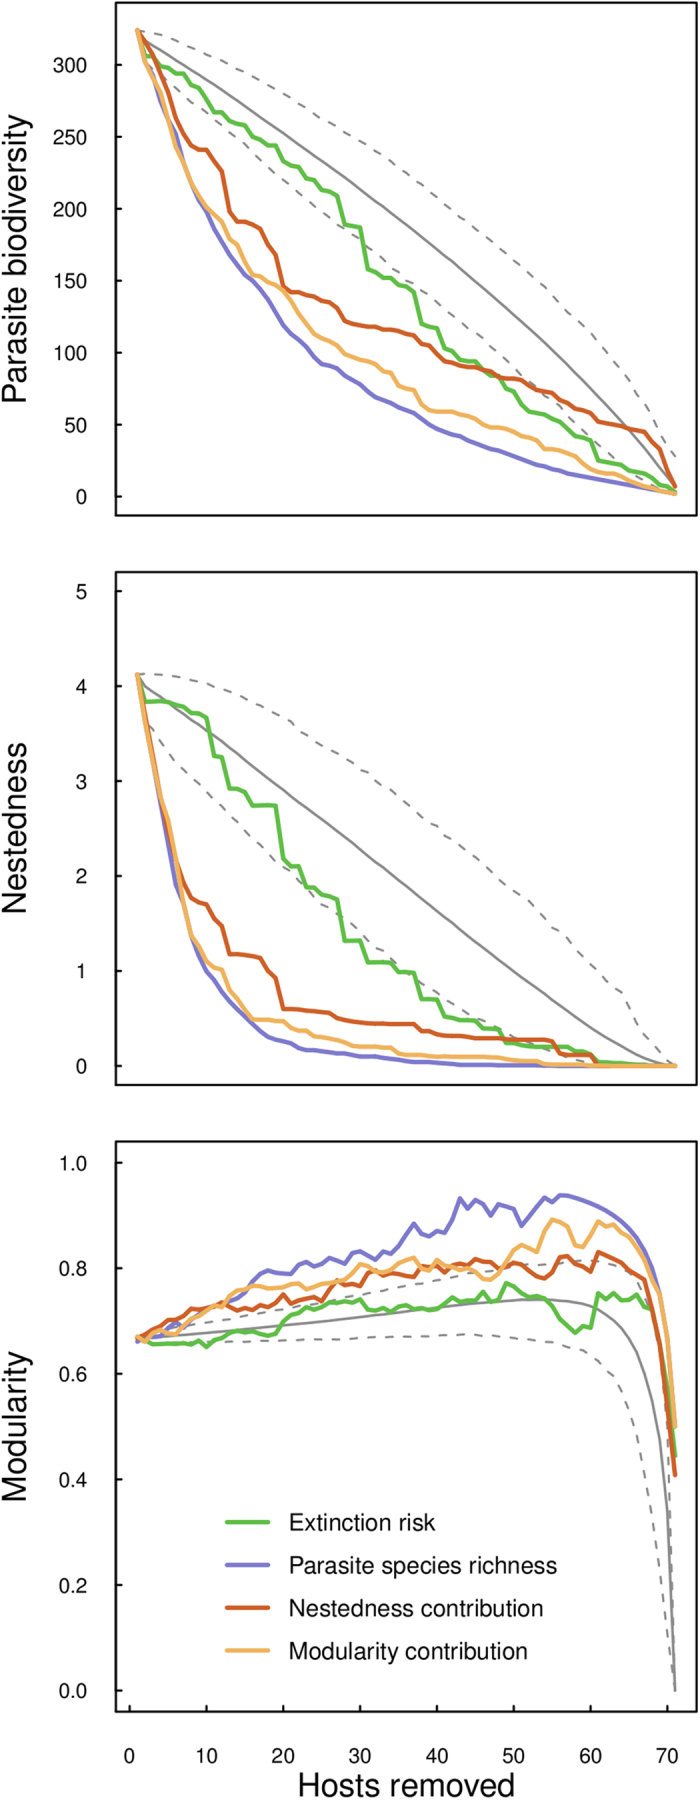
Figure 3. Simulated trajectories examining the decay in parasite diversity (top), nestedness (middle), and modularity (bottom) as a result of simulated sequential host removals.

Host removal based on parasite species richness (purple) resulted in the fastest declines of network metrics examined, followed closely by host removal based on modularity contribution (yellow) and nestedness contribution (red). Host removal by estimated extinction risk (green) did not differ from random extinction in terms of nestedness and modularity losses, but parasite diversity did decline faster relative to random simulations.
