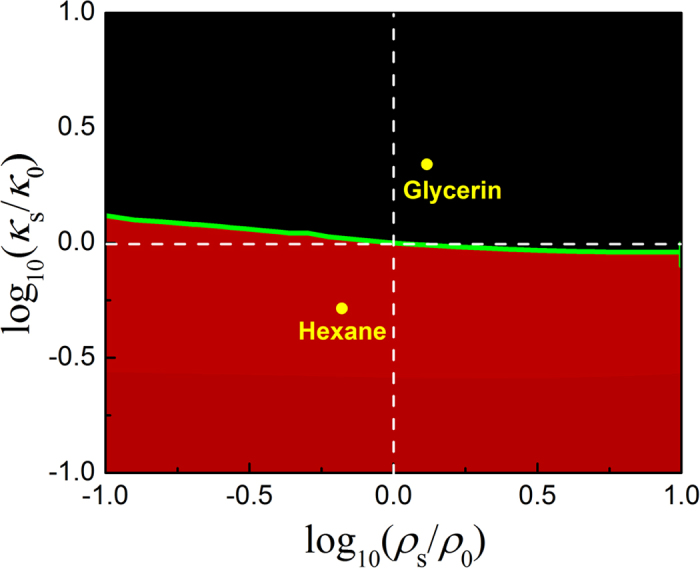
Figure 4. Phase diagram for stability analysis.

The microparticles with acoustic parameters above and below the green curve tend to stay at the dark and bright pressure field regions of the HB beam with α = 6, respectively.

The microparticles with acoustic parameters above and below the green curve tend to stay at the dark and bright pressure field regions of the HB beam with α = 6, respectively.