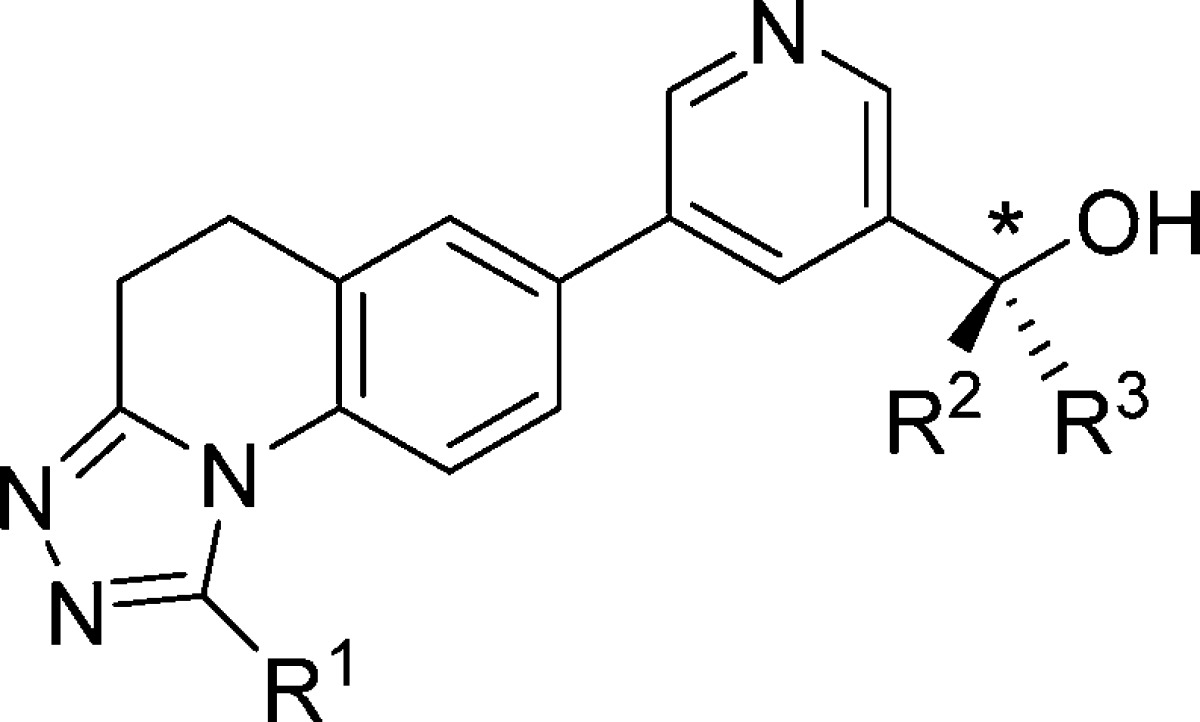
Table 4. Effects of Trifluoromethylation at R1, R2, and R3.

| Cpd | * | R1 | R2 | R3 | hCYP11B2a (IC50, nM) | hCYP11B1a (IC50, nM) | B1/B2b | LLEc | logDd |
|---|---|---|---|---|---|---|---|---|---|
| 14 | CH3 | CH3 | CH3 | 283 | >8333 | 29 | 4.38 | 0.6 | |
| 18 | CF3 | CH3 | CH3 | 526 | 1473 | 3 | 3.02 | 1.5 | |
| 19 | (S) | CH3 | CH3 | CF3 | 64 | 4402 | 69 | 4.36 | 1.2 |
| 20 | (R) | CH3 | CF3 | CH3 | 109 | >8333 | 76 | 4.13 | 1.2 |
| 21 | (S) | CF3 | CH3 | CF3 | 461 | 887 | 2 | 2.42 | 2.2 |
| 22 | (R) | CF3 | CF3 | CH3 | 476 | >8333 | >18 | 2.41 | 2.2 |
IC50s calculated from n ≥ 2, see Supporting Information for details.
Ratio of hCYP11B1 IC50/hCYP11B2 IC50.
Ligand lipophilic efficiency; LLE = pIC50 – aLogP98.
Determined experimentally by HPLC.
