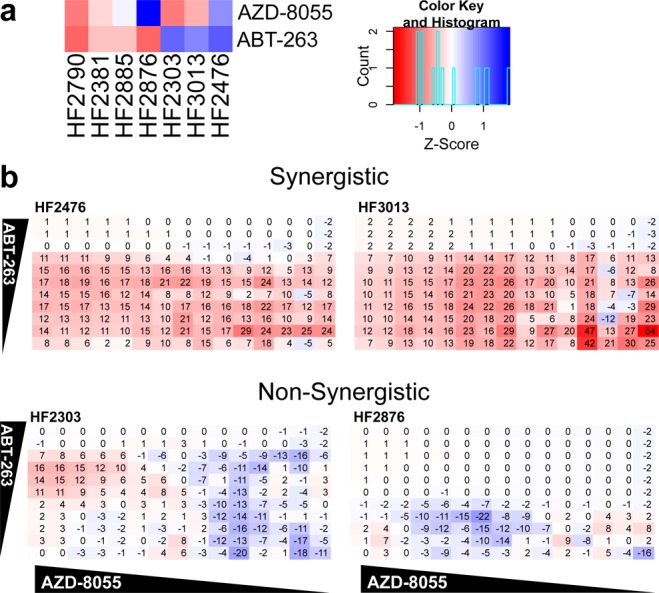
Figure 5.

Combination treatment. (a) Comparison of AZD-8055 and ABT-263 treatment in all cell lines. Red indicates sensitivity, while blue indicates resistance. (b) Depiction of synergism where the values shown are excess over Bliss Independence, a prediction of inhibition without synergism.13,14 Increased synergism is evident by an increased number, shown in red, while negative numbers in blue represent an antagonistic effect.
