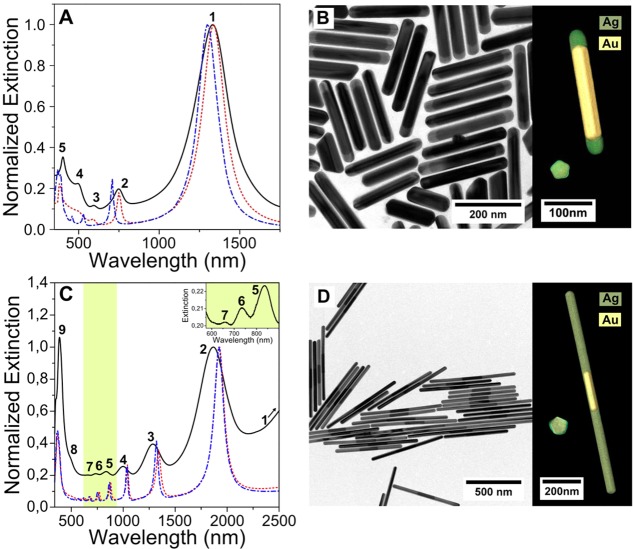
Figure 2.
(A) Vis-NIR spectrum of a colloid of short (AgEn = 0.5) AgAuAg NWs (black line) compared to simulated spectra in the presence (red) and absence (blue) of the PT Au NR core. (B) Representative TEM image showing the high monodispersity of the sample. (C), (D) Same as (A) and (B) for a sample of longer NWs (AgEn = 5.3). Inset of (C) Zoom of the highlighted area discerning high order modes 5, 6, and 7. At the right subpanels of (B) and (D), 3D TEM visualizations of the reconstructed nanowires are presented (green and yellow correspond to silver and gold, respectively), both from one tip (left) and along their length (right).

