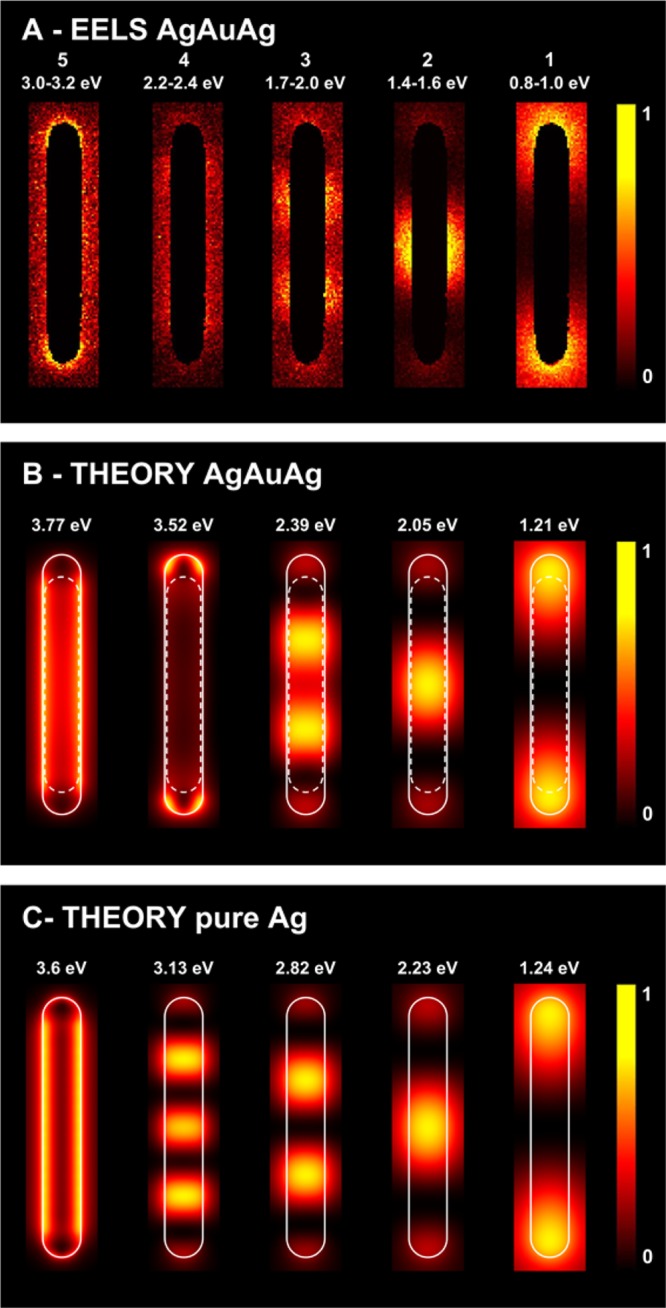
Figure 3.

(A) Spatial distribution of plasmon modes for a short AgAuAg NW (AgEn = 0.5) as measured by EELS; the numbers refer to the same modes as in the Vis-NIR spectrum of Figure 2A. (B) BEM simulations of EELS maps associated with the plasmon modes shown in A, for a NW containing the PT Au NR core. (C) Simulations for a pure Ag NW with the same dimensions. The simulated maps are normalized to the maximum intensity in each case. The silver (gold) surface is indicated with solid (broken) white lines in the calculated maps.
