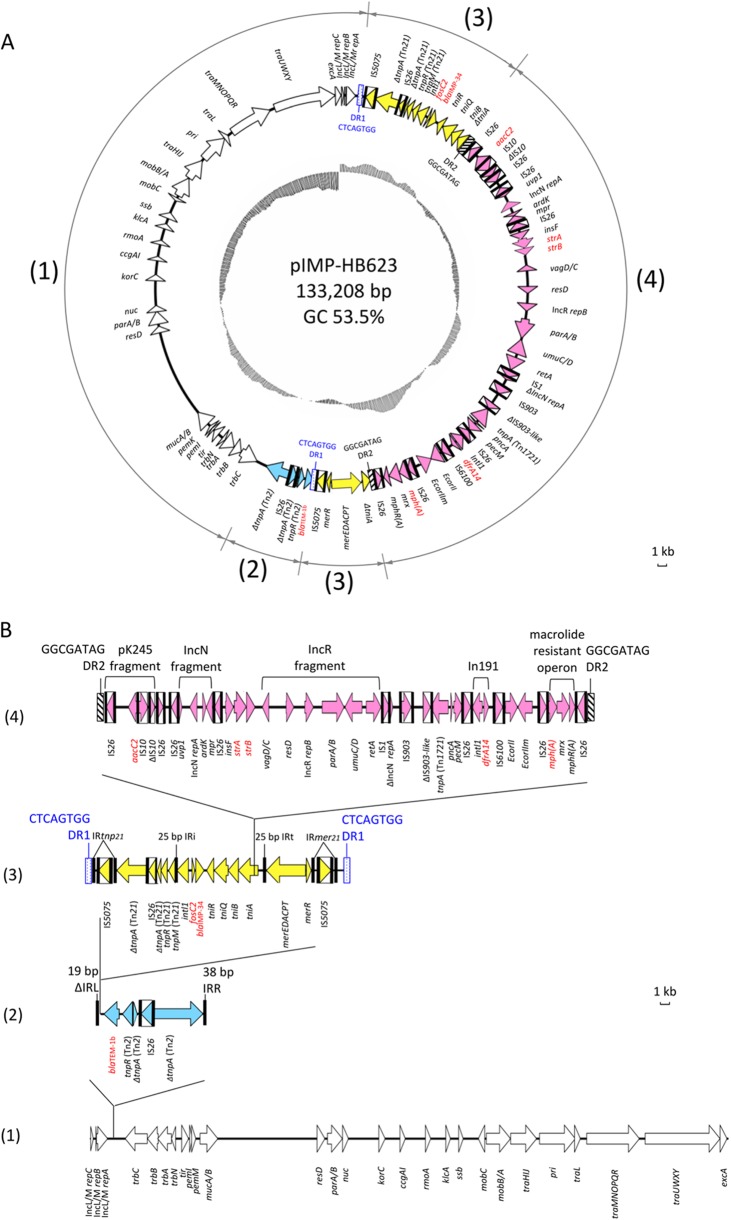
FIG 1.
(A) Circular map of pIMP-HB623. Open reading frames (ORFs) are colored coded, with the direction of transcription indicated by arrowheads. ORFs with unknown function are not shown. Insertion sequence (IS) elements are represented by boxes, with the arrows inside the boxes indicating the transposases. Black bars are used to indicate inverted repeats associated with IS elements (IS1, IS3, IS10, IS26, IS903, IS5075, and IS6100), Tn2 (ΔIRL, IRR), Tn21 family transposons (IRtmp21, IRmer21), and integrons (IRi and IRt). Duplication repeats are represented by rectangular boxes (DR1, blue and dotted boxes; DR2, black and hatched boxes). Resistance genes are indicated in red font. The numbers in the outer circle indicate the following regions: (1) IncL/M plasmid scaffold (white arrows), (2) Tn2-based module (blue arrows), (3) Tn5075 module (yellow arrows), and (4) IS26 transposon-like structure (pink arrows). The G+C plot is indicated in the inner circle (mean, 53.5%). (B) Linear map of pIMP-HB623 showing the putative insertion events that have contributed to the formation of the multidrug-resistant region. The modules are identified, and other features are represented as described for panel A. Scale bars show the sequence length for 1 kb. For the purpose of illustration, duplication repeats and inverted repeats are not drawn to scale.

