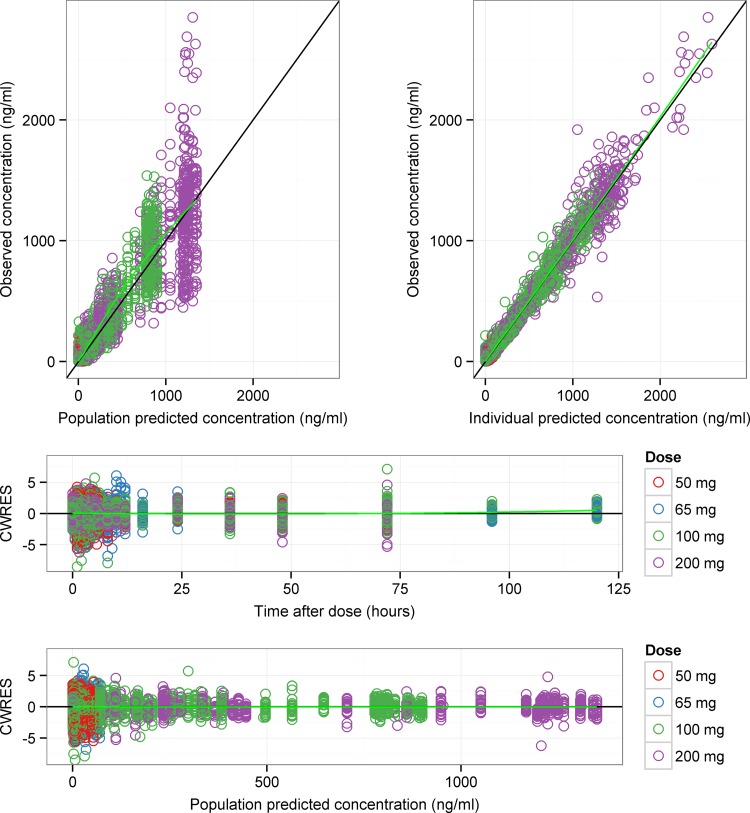
FIG 1.
Goodness-of-fits plots of the final itraconazole model of single- and multidose data. In each plot, the symbols are data points, the solid black line is a line of identity with slope 1 (top two panels) or 0 (bottom two panels), and the solid green line is a Loess smooth of the data. Itraconazole data points for the different itraconazole doses used in the pharmacokinetic studies are colored in red (50 mg), blue (65 mg), green (100 mg), and purple (200 mg). CWRES, conditional weighted residuals.

