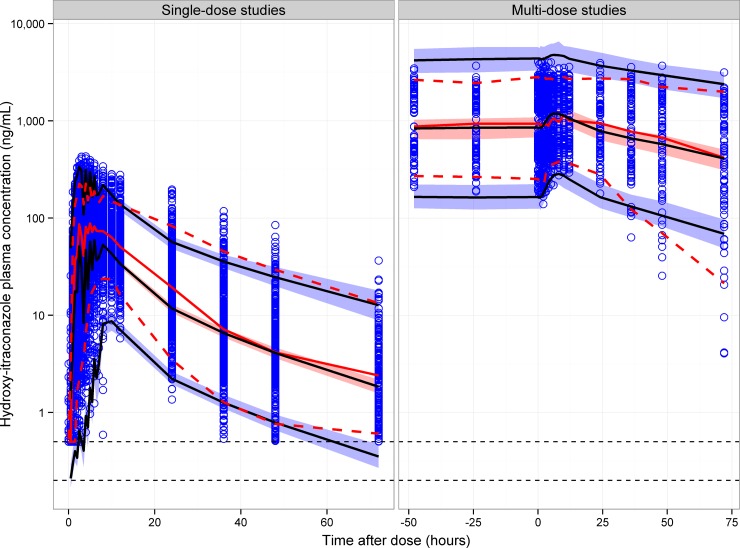
FIG 6.
Visual predictive checks of hydroxyitraconazole for single-dose and multidose studies. Open circles represent observed hydroxyitraconazole concentrations. The solid black lines represent the 5th, 50th, and 95th percentiles of the simulated concentrations. The shaded area represents the 90% confidence interval of the 5th, 50th, and 95th percentiles of the simulated concentrations. The solid red line represents the median of the observed concentrations. The dashed red lines represent the 5th and 95th percentiles of the observed concentrations. The horizontal dotted lines represent the lower limit of quantitation (LLOQ) of hydroxyitraconazole for the U.S. (upper line) and United Kingdom (lower line) studies.

