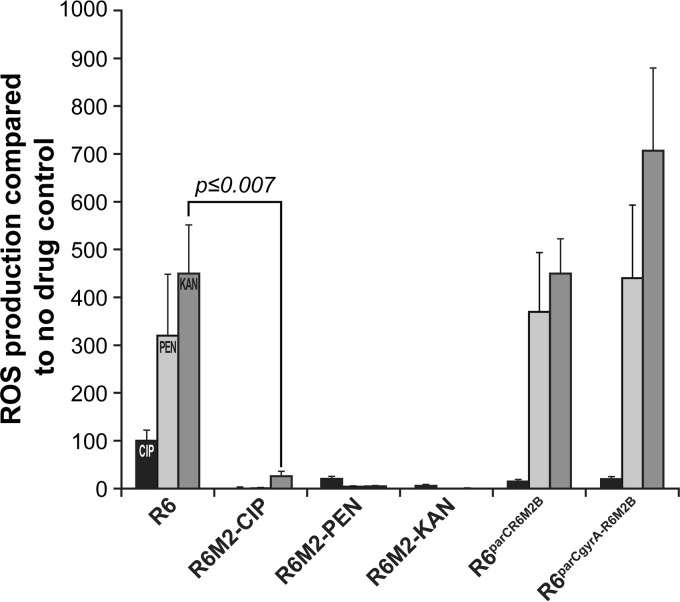
FIG 2.
ROS production in WT S. pneumoniae R6 and laboratory-derived resistant mutants and resistant transformants after 3 h of exposure to bactericidal antibiotics. Results were normalized according to viable cell counts and are expressed as the rate of ROS production compared to that in the no-drug control. Results are averages from three independent experiments. The significance of differences in ROS production was confirmed by Student's t test. The last two strains were WT S. pneumoniae R6 transformed with the parC or the parC and gyrA genes derived from R6M2B-CIP.

