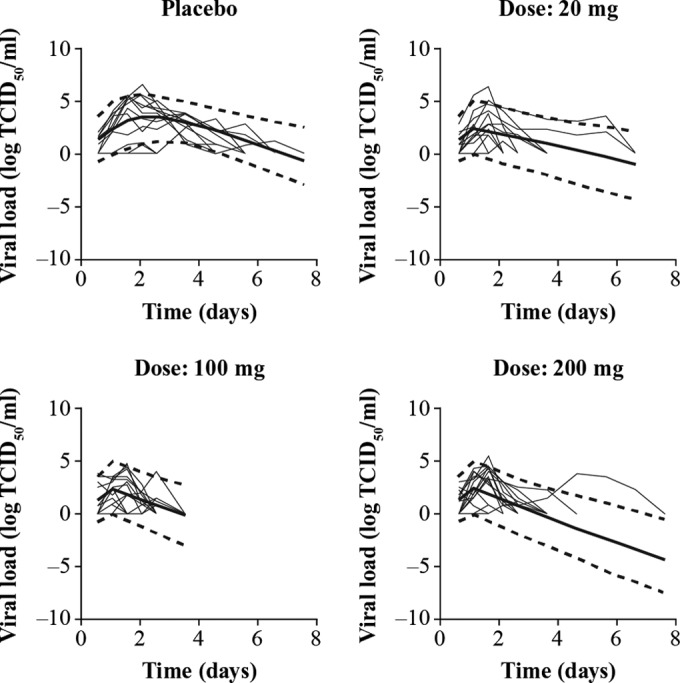
FIG 2.

VPCs showing the central tendency and variability in influenza viral progression of placebo and oseltamivir treatment cohorts (study PV15616). Viral load is measured from nasopharyngeal swabs as log10 TCID50/ml where TCID is the tissue culture infective dose. The thin solid lines indicate observed individual viral load data, while the thick solid line indicates the model simulated median and dotted lines the simulated 5th and 95th percentiles.
