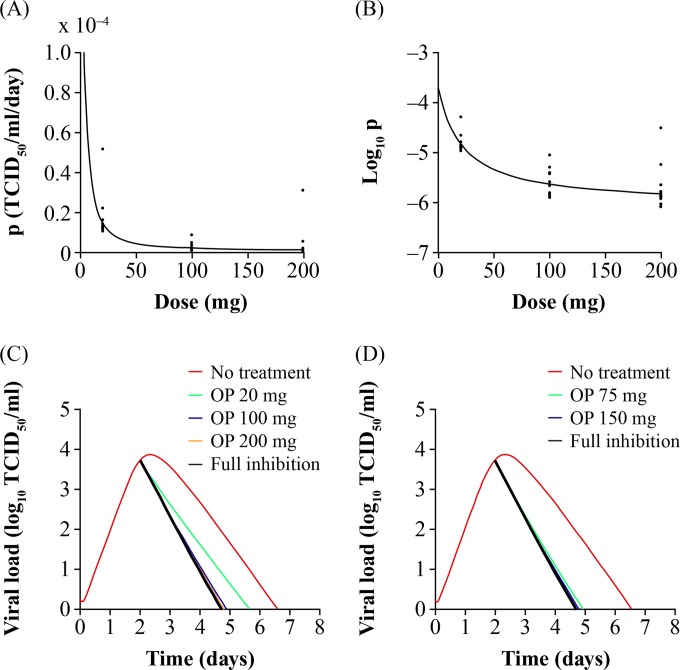
FIG 4.
Oseltamivir dose-response relationships. Dose-response curves of oseltamivir action on the production of virus (p) (A) and the log10 of p (B). (C) Influenza viral titer curves simulated under no treatment, at phase II study doses and full inhibition (oseltamivir dose set to infinity). (D) Influenza viral titer curves under no treatment, at phase III study doses and full inhibition. Oseltamivir therapy was initiated 2 days after infection and administered b.i.d. for 5 days. OP, oseltamivir phosphate.

