
FIG 2.
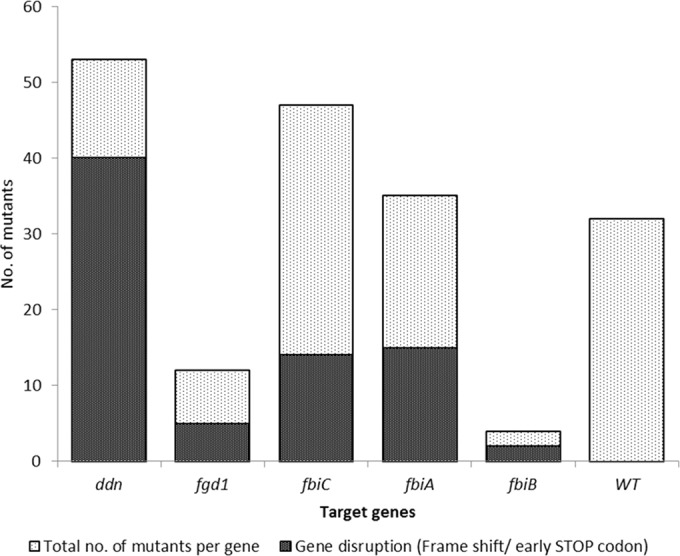
Distribution of mutation frequencies among the five target genes. The relative number of genes encoding early STOP codons and out-of-frame insertions and deletions is shown in gray.
Official websites use .gov
A
.gov website belongs to an official
government organization in the United States.
Secure .gov websites use HTTPS
A lock (
) or https:// means you've safely
connected to the .gov website. Share sensitive
information only on official, secure websites.
Distribution of mutation frequencies among the five target genes. The relative number of genes encoding early STOP codons and out-of-frame insertions and deletions is shown in gray.