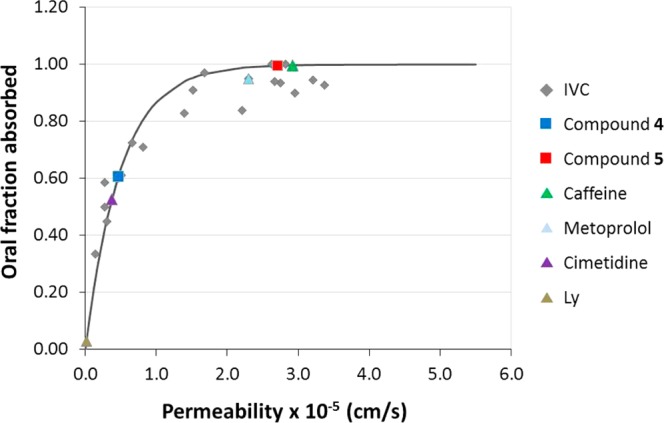
Figure 12.

Correlation between oral fractions absorbed vs permeability values obtained from Caco-2 cell monolayers transport assay in apical to basal direction (PAB). Gray diamonds correspond to the internally validated correlation (IVC).54 Triangles correspond to permeability reference compounds (metoprolol/caffeine for high permeability, cimetidine for intermediate permeability, and Lucifer Yellow for low permeability). Light gray squares correspond to tested compounds 4 and 5.
