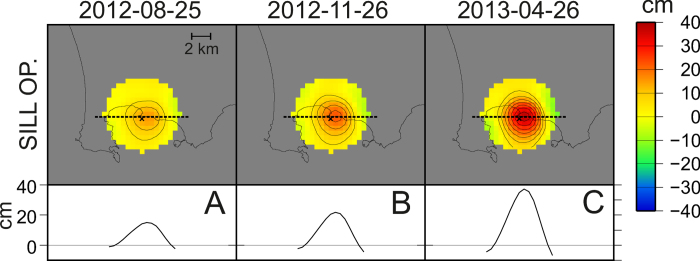
Figure 2. Results of the geodetic imaging for three selected intervals.

(D–F in Fig. 1). The cross represents the point of coordinates (14.20°E 40.82°N). (A–C) Opening of the sill (at 3100 m depth). On the top of each panel we show maps of the sill opening. Contours spacing is 5 cm. On the bottom we represent the opening along the profiles marked by dashed lines. All the maps were realized with the software GMT (http://gmt.soest.hawaii.edu).
