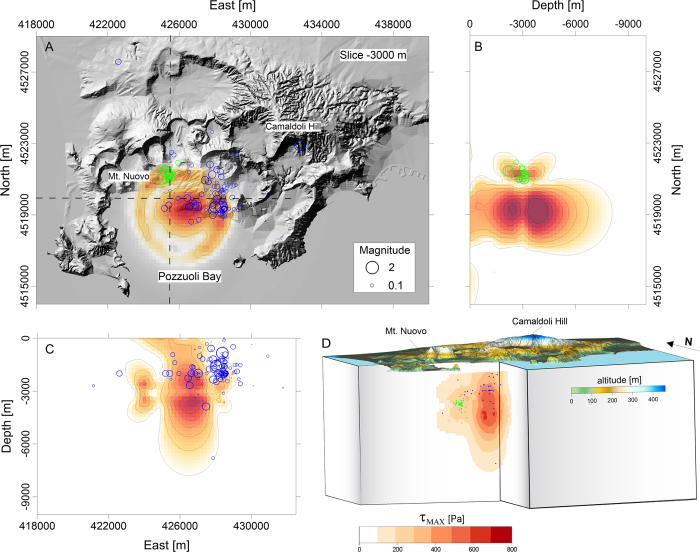
Figure 4. Elastic stress field variations due to the intrusion of the sill.
We considered a cumulative opening of 12 cm relevant to January-September 2012 time interval. (A) Map of τMAX (maximum shear stress) at a depth of 3000 m b.s.l. superimposed on the shaded relief map of the CFc. Earthquake hypocenters are reported in green for the September 2012 seismic swarm, while they are in blue for the 2005–2012 interval. In (B,C) the N-S and E-W cross-sections of τMAX are reported. (D) 3D view of τMAX field distribution resulting from the structural mechanics modeling. All the maps were realized with the software Surfer®.

