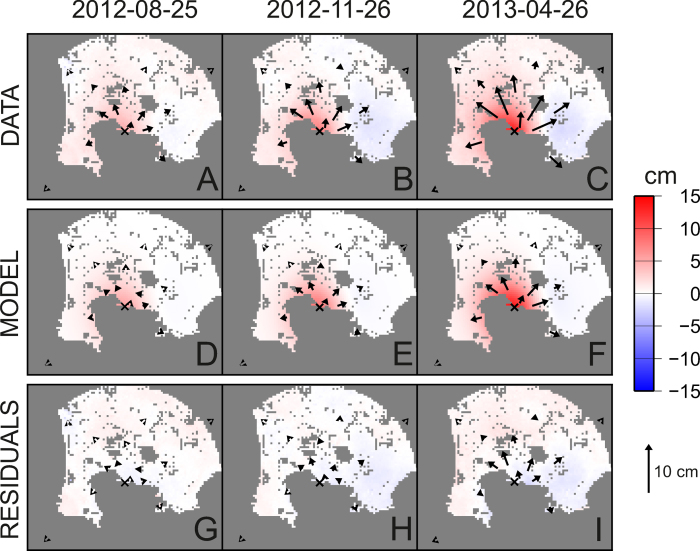
Figure 8. Data, model and residuals for the geodetic imaging technique for three selected intervals.
(D–F in Fig. 1). (A–C) Observed deformation. The color shading represents the COSMO-SkyMed LOS displacements. Horizontal GPS displacements are indicated by arrows whose length scale is shown on the bottom right. (D–F) Synthetic model. (G–I) Corresponding residuals (data-model). All the maps were realized with the software GMT (http://gmt.soest.hawaii.edu).

