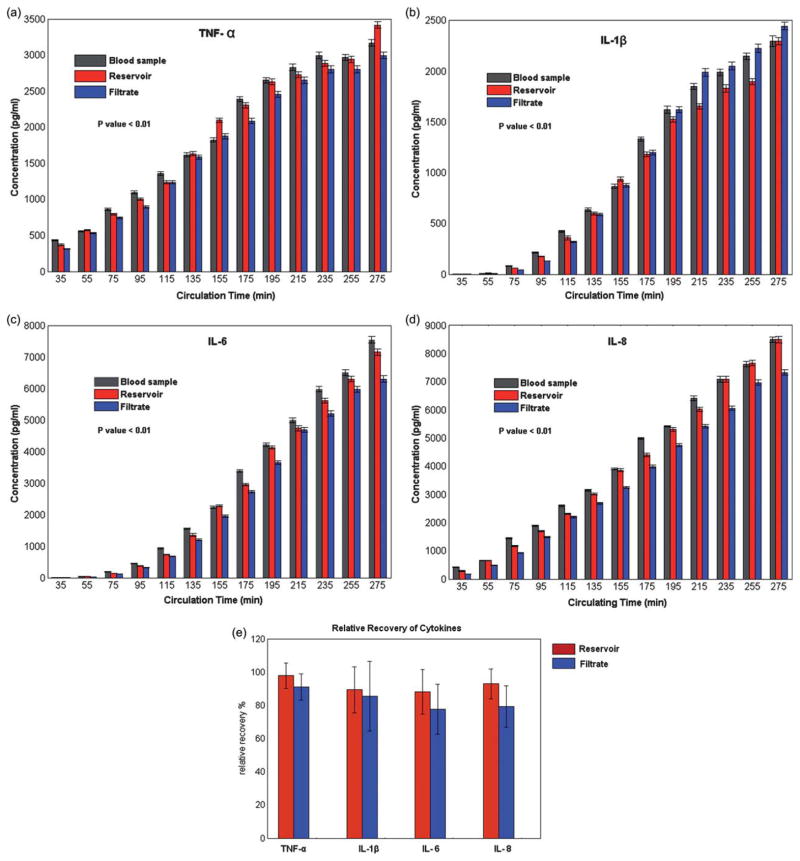
Fig. 5.
(a–d) Comparison of outlet cytokine (TNF-α, IL-1β, IL-6, and IL-8) concentrations from 13 discrete samples collected every 20 min with the microfiltration device channels (Reservoir and Filtrate) and a direct draw from the CPB membrane oxygenator arterial port (Blood Sample). The cytokine concentration increases significantly over the sampling period for each protein analyzed. The error bars represent the standard deviation of the flow cytometry bead fluorescence. (e) Average normalized recovery from the reservoir and filtration sample collected which was over 80% for all the analyzed samples.

