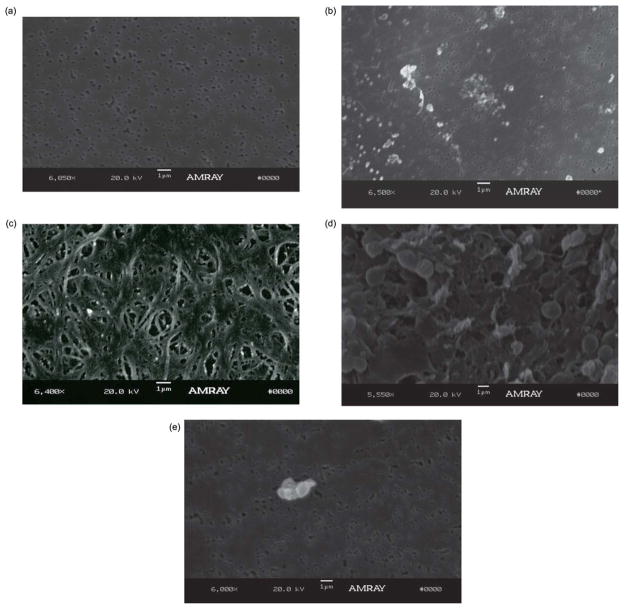
Fig. 6.
Representative SEM images of porous PCTE membranes. (a) SEM images of PCTE membrane before being exposed to blood, (b) PCTE membrane after being exposed to human blood (Hct~30%). Although some protein aggregation is seen on the membrane surface after exposure to human whole blood, the underlying pores in the membrane can be clearly seen, and are not clogged. (c) PCTE membrane after being exposed to sheep blood (Hct~30%) shows significant amount of protein adhesion to membrane surface, (d) non-coated PCTE membrane after being exposed to sheep’s blood (Hct = 39%) and (e) heparin coated PCTE membrane after being exposed to the same blood (Hct = 39%).

