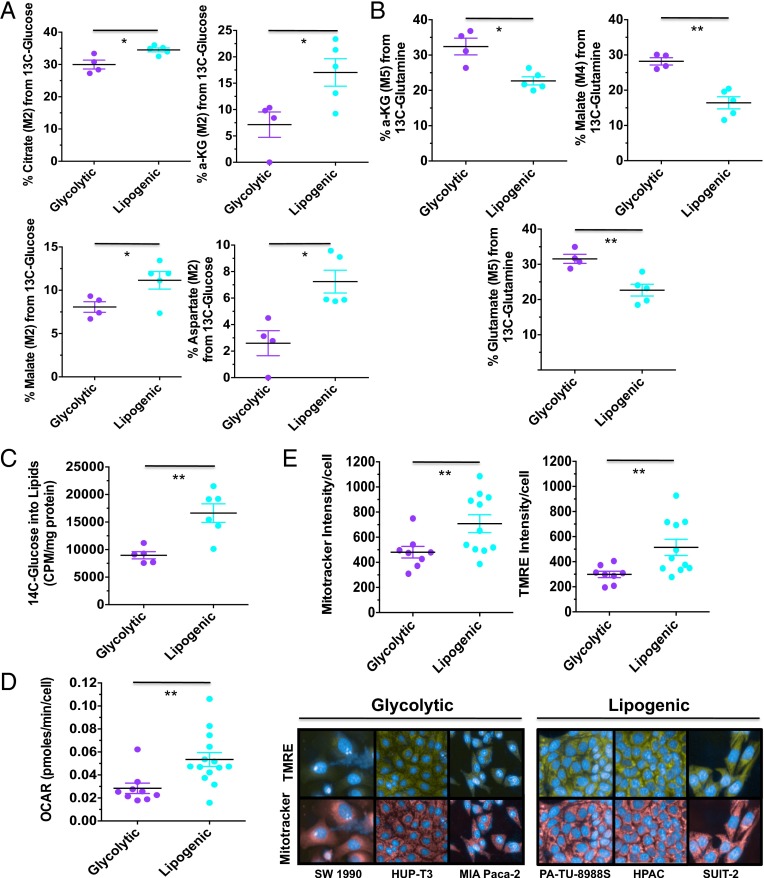
Fig. 2.
Functional characterization of glycolytic and lipogenic subtypes. (A) Comparison of relative contribution of glucose oxidation to the TCA metabolites, determined by M2 labeling from [U-13C6]glucose for citrate, αKG, malate, and aspartate between glycolytic and lipogenic cell lines. (B) Comparison of relative contribution of reductive glutamine metabolism to TCA metabolites, determined by M5 labeling from [U-13C5]glutamine for αKG and glutamate, and M4 labeling for malate between glycolytic and lipogenic cell lines. (C) Comparison of relative contribution of glucose metabolism to de novo lipid synthesis between glycolytic and lipogenic cell lines. Cells were labeled with 1 μCi/mL d[U-14C] glucose for 6 h, and lipids were extracted. The incorporation of 14C into lipids was determined by scintillation counting. (D) Comparison of oxygen consumption rates (OCRs) between glycolytic and lipogenic cell lines. (E) Comparison of relative mitochondria number (Mitotracker intensity per cell) and potential/fitness (TMRE per cell) between glycolytic and lipogenic cell lines. For A–E, the mean and SD between cell lines belonging to the glycolytic subtype vs. lipogenic subtype is plotted where each cell line is shown as one dot, representing the mean of three replicates. Data are normalized to sample protein content (A–C) or cell number (D and E). Asterisks denote a statistically significant difference by unpaired t test with Welch’s correction (*P < 0.05, **P < 0.01, ***P < 0.001).

