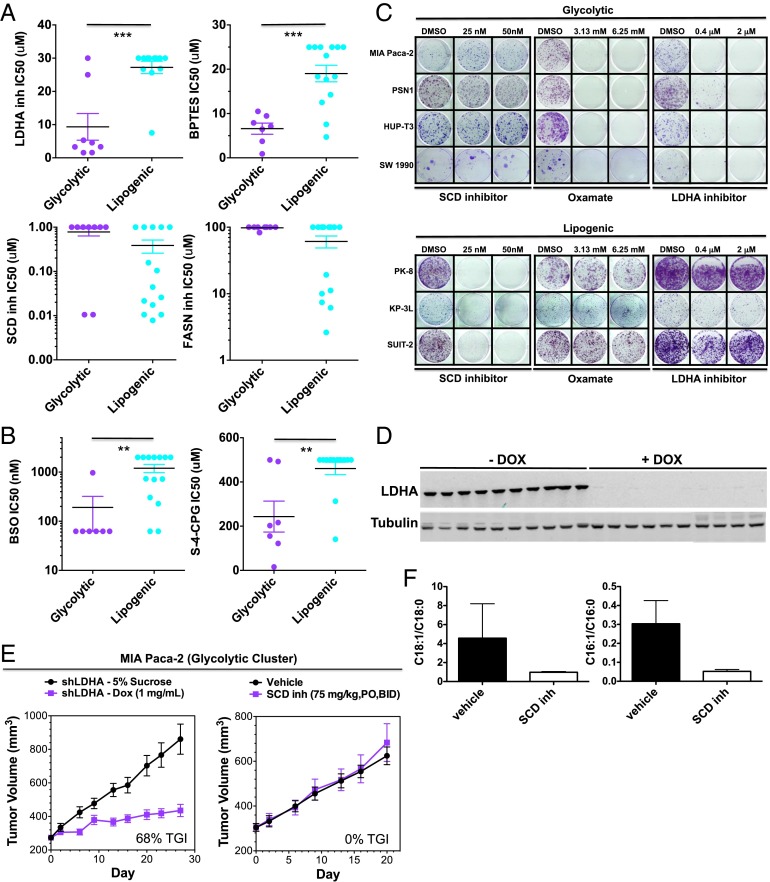
Fig. 3.
Glycolytic and lipogenic cell lines show distinct sensitivity to various metabolic inhibitors both in vitro and in vivo. (A) Comparison of IC50 values to various metabolic inhibitors between representative glycolytic vs. lipogenic cell lines in short-term (3 d) viability assays. Saturated IC50 values correspond to cell lines where an IC50 was not reached at the maximum drug concentration. The mean and SD between cell lines belonging to the glycolytic vs. lipogenic subtype is plotted where each cell line is shown as one dot, representing the mean of three replicates. Asterisks denote a statistically significant difference by Mann–Whitney test (*P < 0.05, **P < 0.01, ***P < 0.001). (B) Comparison of IC50 values to various ROS-inducing agents between representative glycolytic vs. lipogenic cell lines in short-term (3 d) viability assays, similar to A. (C) Comparison of sensitivity to oxamate, LDHA, or SCD inhibitors between representative glycolytic vs. lipogenic cell lines in longer-term (12 d), low seeding density growth assays. (D) Western blots showing 98% in vivo knockdown of LDHA levels in MIA Paca-2 xenografts administered with doxycycline (1 mg/mL) for 8 d vs. 5% sucrose. (E) In vivo knockdown of LDHA (n = 10 for each group) results in 68% TGI, 95% confidence interval [48, 83] in the MIA Paca-2 shLDHA model of a glycolytic subtype tumor, whereas treatment with an SCD inhibitor (75 mg/kg, orally, BID) resulted in no significant change in tumor volume. (F) Confirmed pharmacodynamic inhibition of lipid metabolism by SCD inhibitor. The SCD inhibitor reduces desaturation of palmitate and stearate in MIA Paca-2 shLDHA xenograft tumor tissues and in mouse liver and plasma (n = 5 per group). Data are presented as mean ± SD.

