Fig. S1.
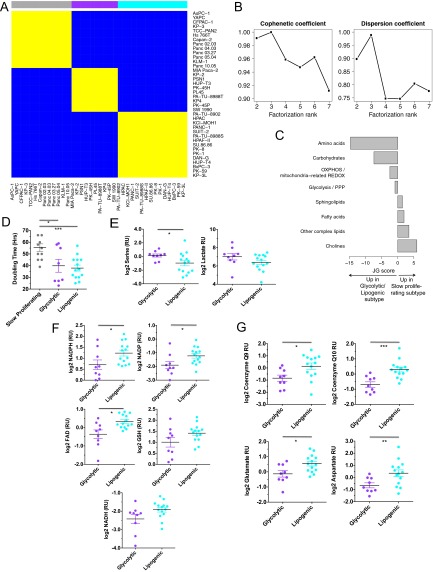
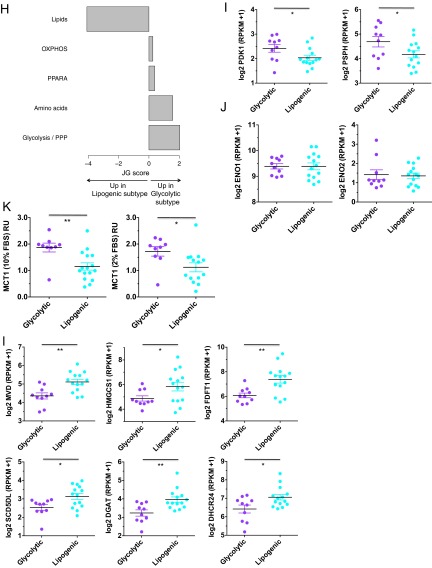
Related to Fig. 1. (A) Cell line-by-cell line consensus heatmap shows the clustering consensus obtained with nonnegative matrix factorization (NMF) based on 200 runs (21); yellow color indicates similar metabolic profiles and blue indicates dissimilar. The three identified subtypes are colored on top: slow proliferating subtype in gray, glycolytic subtype in purple, lipogenic subtype in cyan. (B) Cophenetic coefficient (measure of subtype stability) and dispersion coefficient (measure of subtype robustness) in function of the number of subtypes ranging from 2 to 7. The cophenetic coefficient equals 1 for a perfect consensus matrix with entries 0 and 1 and decreases when entries become scattered between 0 and 1. (C) Relative enrichment of the eight metabolic ontology classes in the slow proliferating subtype vs. the glycolytic/lipogenic subtypes, represented by JG score (47). Positive scores represent ontologies enriched for metabolites with high intensities in the slow proliferating subtype. Negative scores represent ontologies characteristic of the glycolytic/lipogenic subtypes. See Dataset S1 for a list of metabolites per ontology and Dataset S4 for the list of differentially expressed metabolites. (D) Doubling time for all cell lines grouped by subtype, with a lower proliferation rate for cell lines in the slow proliferating subtype. Proliferation was measured using CyQUANT Cell Proliferation Assays. Data from Dataset S7. (E) Normalized metabolite intensity level for lactate involved in glycolysis. RU stands for relative unit, similar to Fig. 1C. (F) Normalized metabolite intensity levels for metabolites involved in redox pathways that were differentially expressed between glycolytic and lipogenic lines. RU stands for relative unit, similar to Fig. 1C. (G) Normalized metabolite intensity levels for metabolites involved in the electron transport chain and aspartate/malate shuttle that were differentially expressed between glycolytic and lipogenic subtype lines. RU stands for relative unit, similar to Fig. 1C. (H) Relative enrichment of the five curated metabolism gene sets in the glycolytic and lipogenic subtypes, represented by JG score. Positive scores represent gene sets enriched in the glycolytic subtype. Negative scores represent gene sets characteristic of the lipogenic subtype. The transcriptomic profile of the glycolytic subtype is enriched with genes involved in glycolysis and pentose phosphate. Cell lines from the lipogenic subtype show higher expression of lipid synthesis genes. Dataset S5 lists genes per gene set, and Dataset S6 lists differentially expressed genes. (I) Expression of several of the glycolysis genes that were differentially expressed between glycolytic and lipogenic lines (Dataset S5 and Fig. 1E). (J) Enolase homologs ENO1 and ENO3 show no differential expression between glycolytic and lipogenic lines. The expression profile for ENO2 is shown in Fig. 1F. (K) Western blots and quantification of Mct1 protein in glycolytic and lipogenic lines (quantification normalized to HSP90). (L) Expression of several of the fatty acid synthesis genes (cholesterol and lipids) that were differentially expressed between glycolytic and lipogenic lines (Dataset S5 and Fig. 1F). Asterisks denote a statistically significant difference by t test (*P < 0.05, **P < 0.01, ***P < 0.001).


