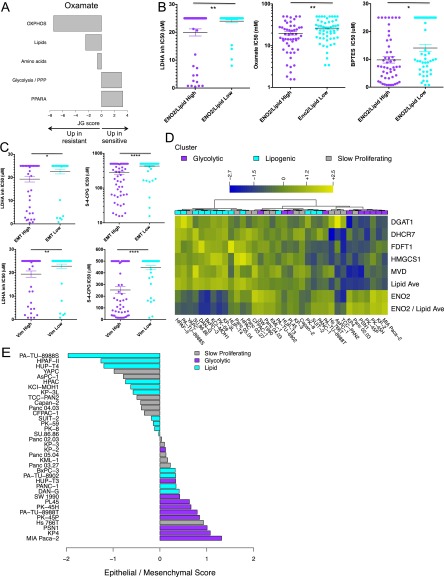
Fig. S3.
Related to Fig. 4. (A) Relative enrichment of the five curated metabolism gene sets in cell lines that are sensitive (positive JG score) or resistant (negative JG score) to oxamate in a pan-cancer panel of 133 nonpancreatic cell lines after exclusion of cell lines with intermediate response. See Dataset S5 for a list of genes per gene set. (B) Ratio of ENO2 expression to average lipid gene expression associates with sensitivity to LDHA inhibitor, oxamate, and BPTES across a variety of tumor types. Saturated values correspond to cell lines where an IC50 was not reached at the maximum drug concentration. Low is defined by RPKM values < lower quartile; high = RPKM values > third quartile. (C) High expression of a pan-cancer EMT signature (EMT) and mesenchymal marker vimentin (Vim) associates with sensitivity to LDHA inhibitor and (S)-4-CPG across a variety of tumor types. EMT and Vim low are defined by RPKM values < lower quartile, EMT and Vim high = RPKM values > third quartile. Asterisks denote a statistically significant difference by Mann–Whitney test (*P < 0.05, **P < 0.01, ***P < 0.001, ****P < 0.0001). (D) Metabolic dependency preference in the panel of 36 PDAC cell lines is based on the ratio of ENO2 expression to the average expression of five lipid genes. Shown are expression (log2 RPKM + 1) of glycolytic gene ENO2, five lipid genes DGAT1, DHCR7, FDFT1, HMGCS1, and MVD, average expression of the five lipid genes (Lipid Ave), and the ratio of ENO2 to average lipid expression (ENO2/Lipid Ave), as per Fig. 4C. Slow proliferating lines are labeled in gray, glycolytic lines in purple, and lipogenic in cyan. Six Slow proliferating lines favor the glycolytic phenotype, and six favor the lipogenic phenotype. (E) Epithelial/mesenchymal score for all PDAC lines based on a 42-gene set characteristic of the classical and QM-PDA subtypes (22). The score is defined as the difference in average expression of QM-PDA vs. classical genes, with a positive score indicative of QM-PDA and a negative score of classical. Cell lines are colored by metabolic subtype, with slow proliferating lines in gray, glycolytic lines in purple, and lipogenic lines in cyan. Six slow proliferating lines are strongly epithelial (of which four are more lipogenic based on expression profiling in D), and six are more mesenchymal (of which four are more glycolytic based on expression profiling).

