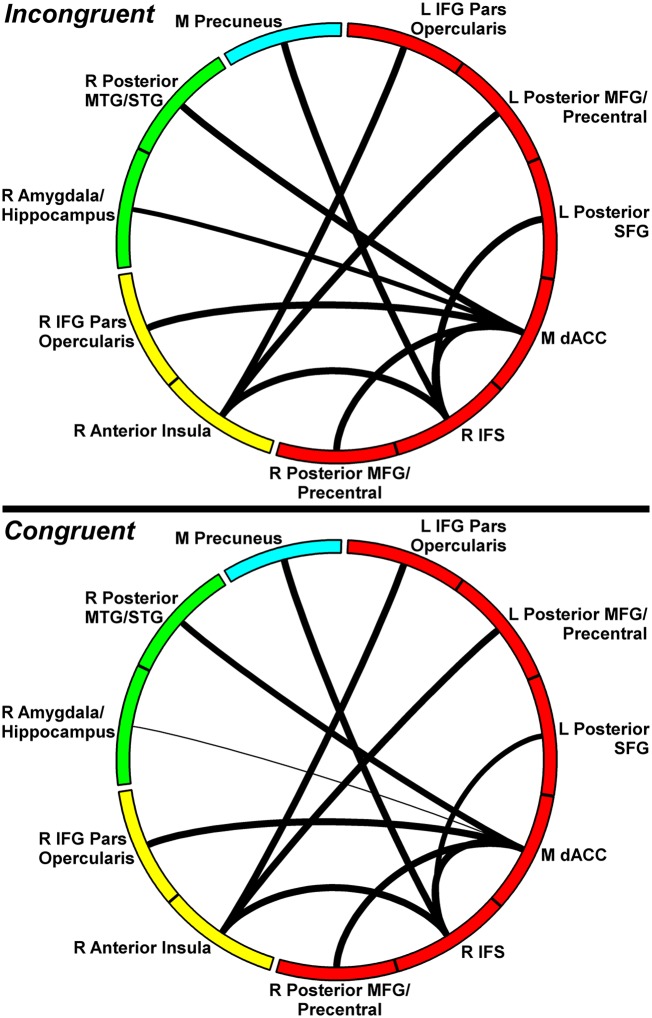
Fig. 2.
Connection strength of the inhibition-related network by condition. Circle segment color reflects module, and connection width reflects connection strength. Upper corresponds to incongruent condition; Lower corresponds to congruent. Only links (and corresponding nodes) identified in NBS analyses are shown above. IFG, inferior frontal gyrus; L, left; M, medial; MFG, middle frontal gyrus; MTG, middle temporal gyrus; R, right; SFG, superior frontal gyrus; STG, superior temporal gyrus.

