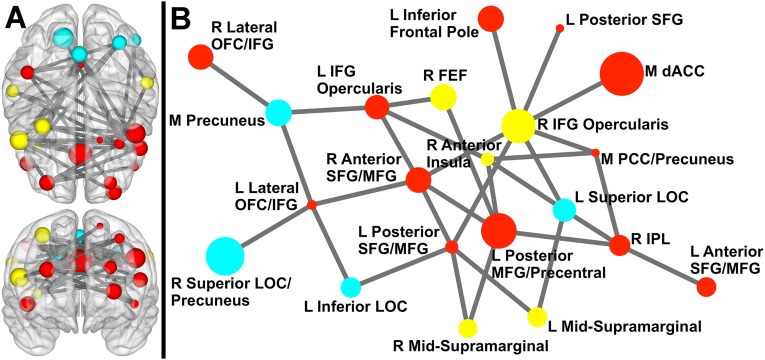
Fig. S3.
Network exhibiting greater coupling for incongruent than neutral. (A) Sphere color represents module membership, and sphere size reflects node strength (across task conditions). Upper is a 3D axial view from above the brain; Lower is a 3D coronal view from anterior to the brain (to maintain the right side of the brain on the right side of the image for both views, posterior is positioned on top for the axial view). Sphere placement in the brain reflects the center of mass location of that node. (B) Circle color represents module membership and circle size reflects node strength. This network representation was created using the Kamada–Kawai spring embedder algorithm. Only links (and the corresponding nodes) that were identified in the NBS analyses as differing significantly by condition are shown above. FEF, frontal eye field; L, left; LOC, lateral occipital cortex; M, medial; OFC, orbitofrontal cortex; PCC, posterior cingulate cortex; R, right.

